Risk Heat Map Presentation Template for PowerPoint & Google Slides
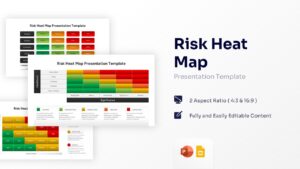


Risk Assessment Matrix and Risk Analysis Visualization
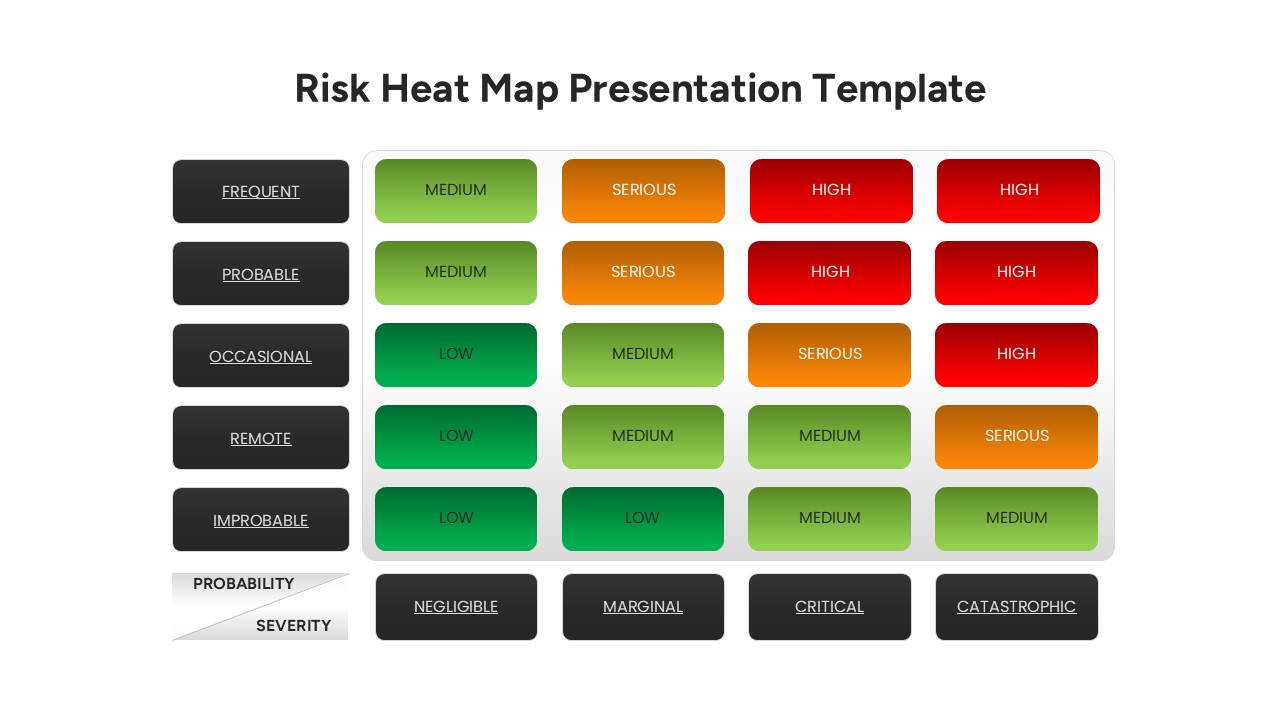
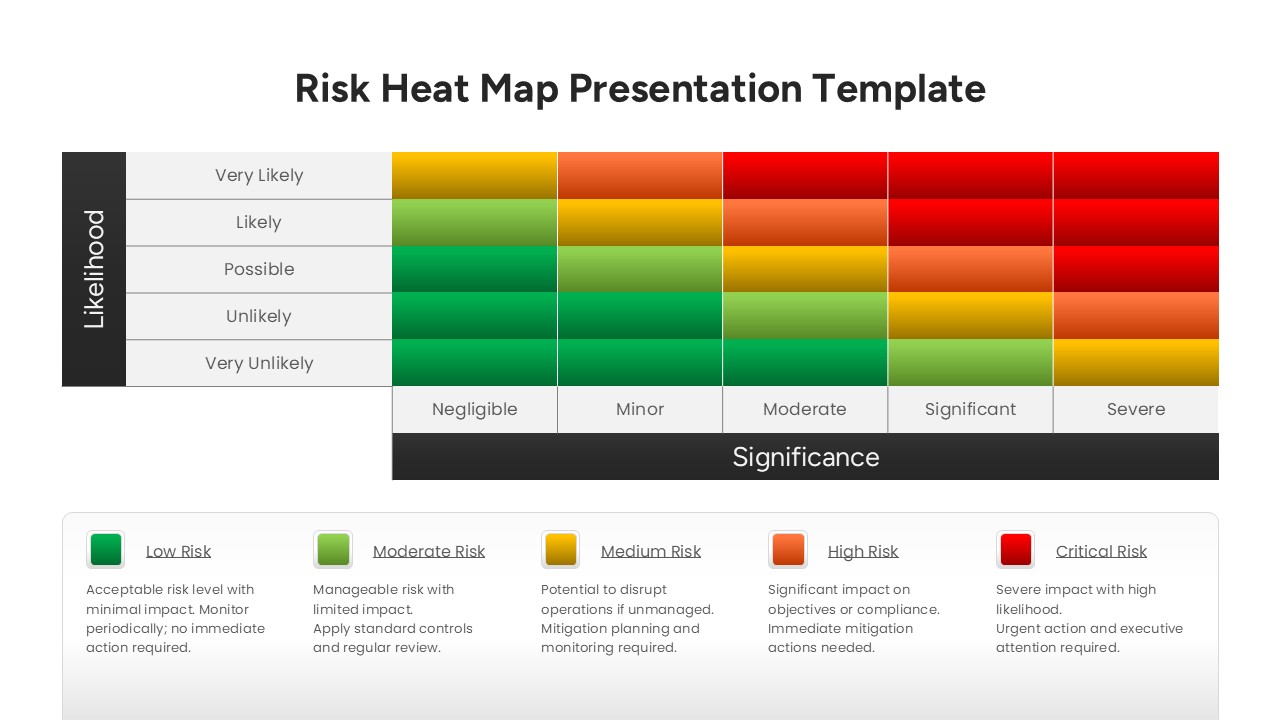
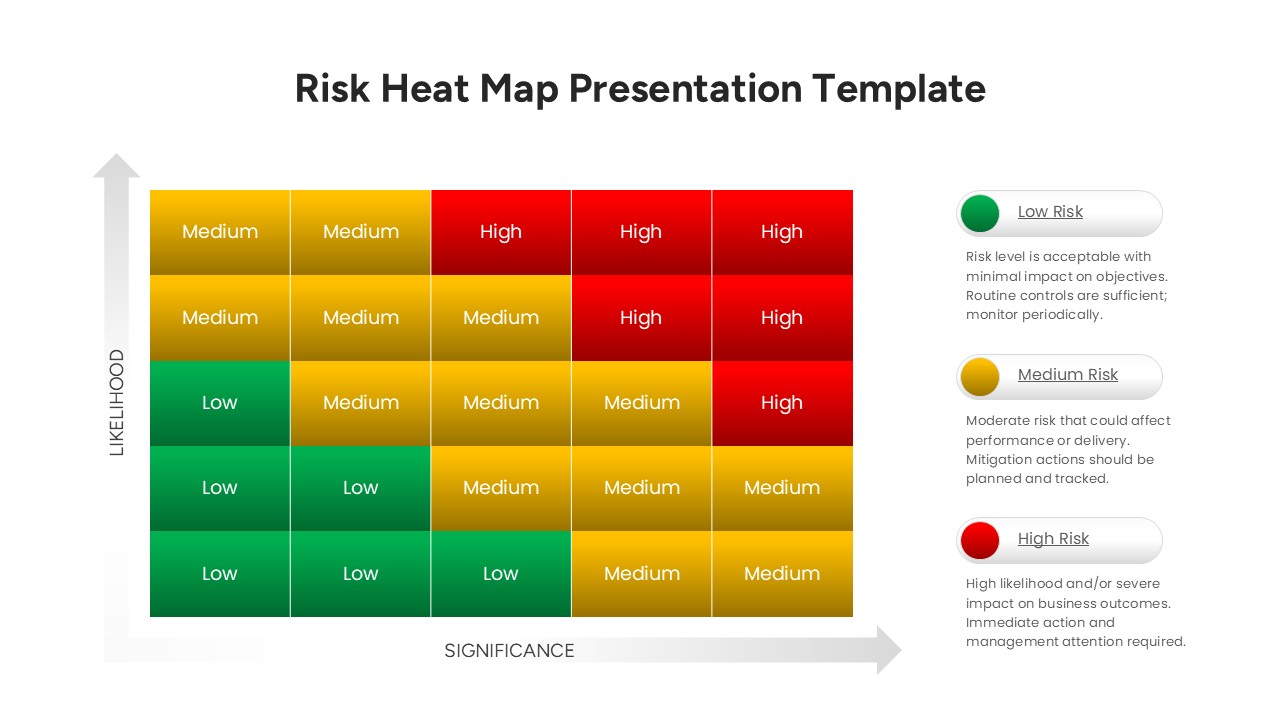
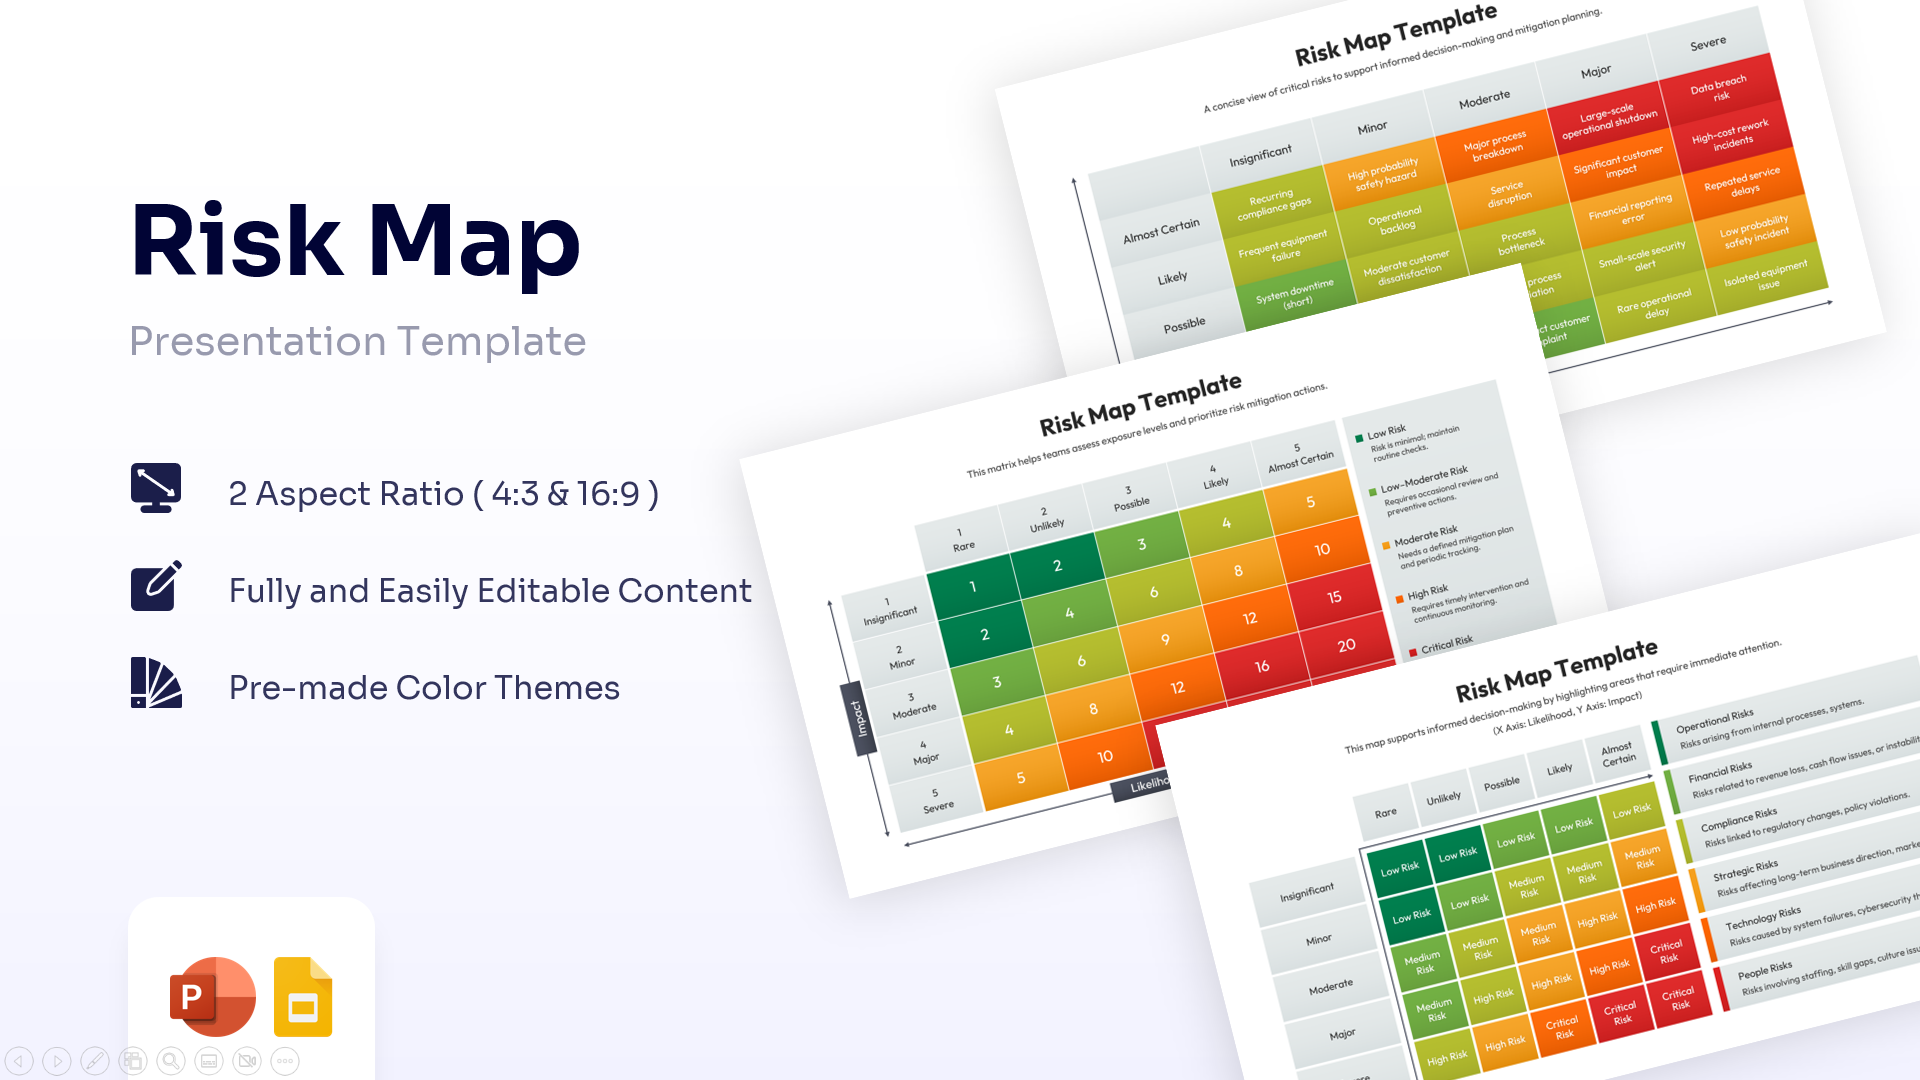
The Risk Heat Map Presentation Template prioritizes clarity and a logical flow of information with a professional and structured design. This presentation template includes a comprehensive range of layouts, from foundational probability-impact matrices and color-coded risk assessment grids to detailed analytical heat maps, risk classification frameworks, and risk severity dashboards, ensuring a cohesive narrative from risk identification through mitigation planning.
The dominant combination of dark gray, green, amber, and red reinforces authority, control, and objective decision-making, while the progressive color scale communicates escalating risk levels with immediate visual recognition. Specific infographic elements include probability versus severity matrices, likelihood-significance heat maps, color-coded risk categorization systems, and risk indicator panels that transform complex operational, financial, compliance, and project-related data into digestible visual summaries. The layouts are particularly effective for presenting enterprise risk frameworks, audit findings, governance reporting, and mitigation strategies while maintaining executive-level clarity. Organizations can also complement these visuals with enterprise risk management presentation slides and business strategy infographics to build more comprehensive reporting workflows. This versatile PresentoVerse template is perfect for formal business environments, particularly for enterprise risk management reviews, project governance reporting, and compliance audit presentations.
Key Features
- 100% Vector-Based Graphics
- Fully Layered & Organized
- Multi-Platform Support
- Theme Color & Theme Font
Frequently Asked Questions
- What is a Risk Heat Map used for?
- A Risk Heat Map is a visual tool used to represent the results of a risk assessment process. It plots risks on a grid based on their likelihood of occurrence and the severity of their impact, helping organizations prioritize which issues need the most resources.
- Can I change the colors of the risk zones?
- Yes, every element in this template is fully editable. You can easily adjust the theme colors in PowerPoint or Google Slides to match your company\'s branding or specific risk reporting standards.
- Is this template suitable for cybersecurity reporting?
- Absolutely. The matrix format is a standard in cybersecurity for mapping out vulnerabilities and threats, making it an ideal choice for IT security presentations.
Related Templates
-
 $2.99
$2.99 -
 $3.99
$3.99 -
 $3.99
$3.99 -
 $3.99
$3.99