Free SIPOC Diagram Template for PowerPoint and Google Slides


SIPOC Process Map Infographic Template
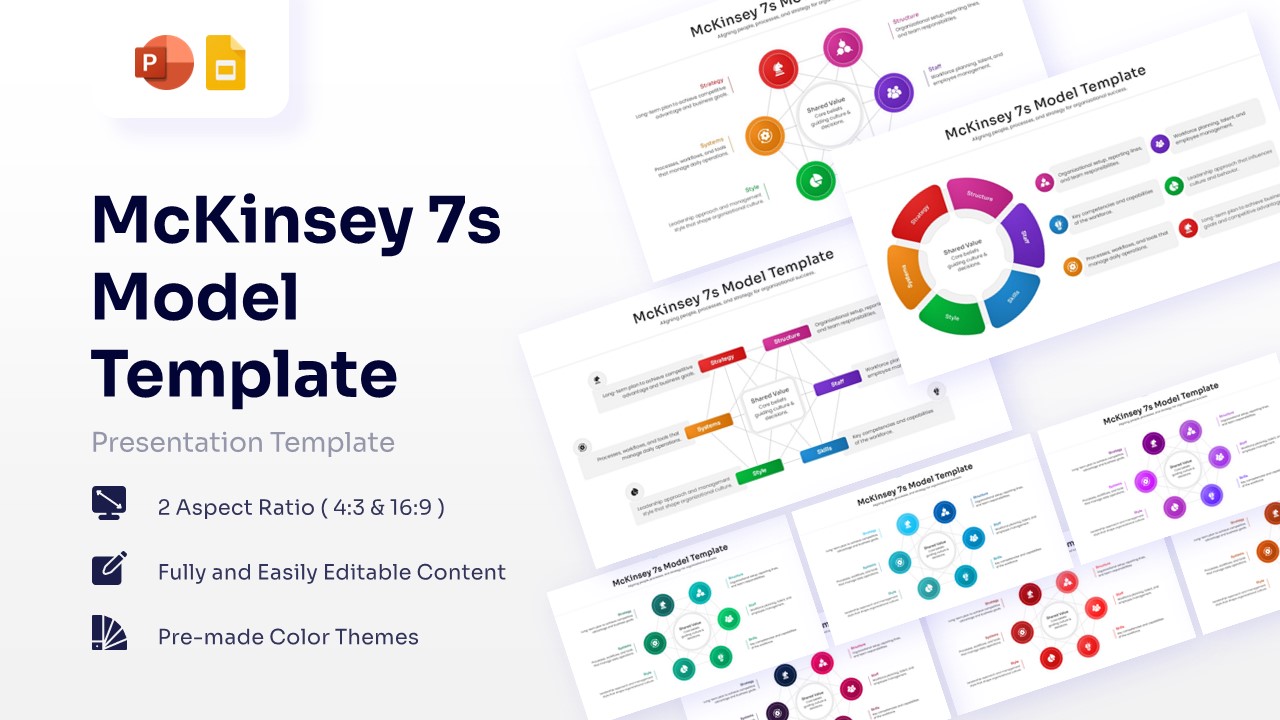
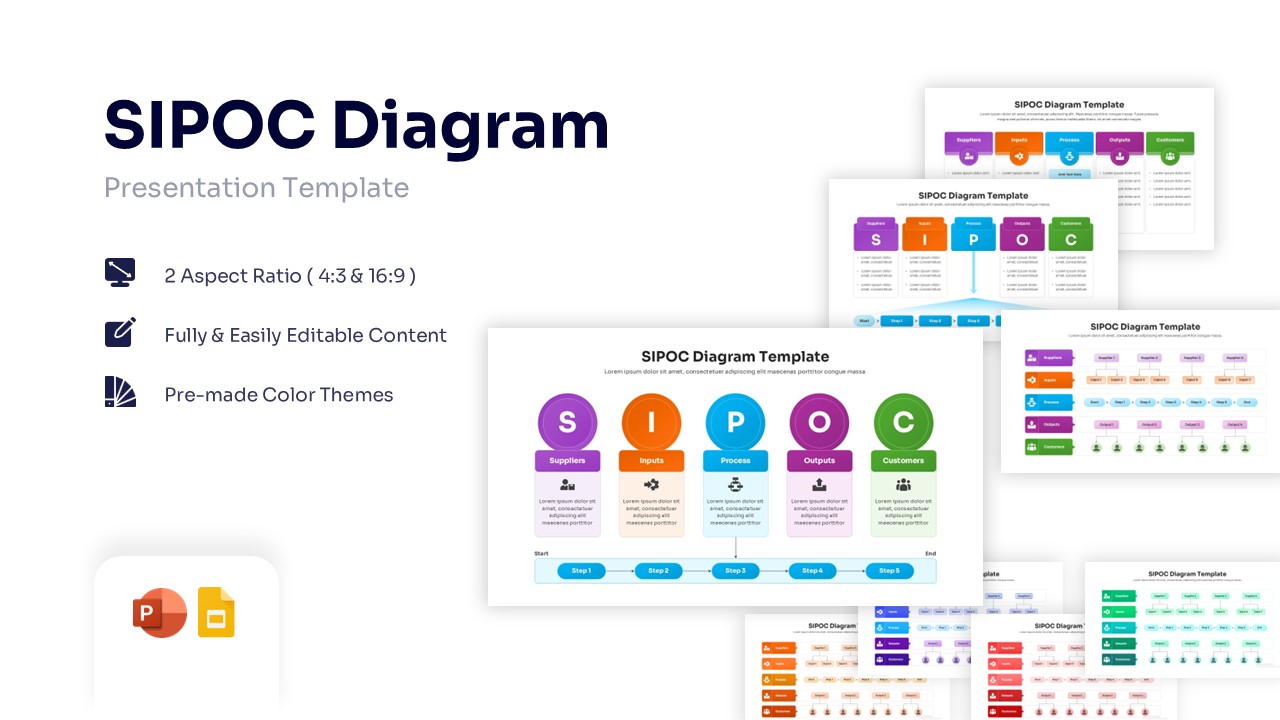
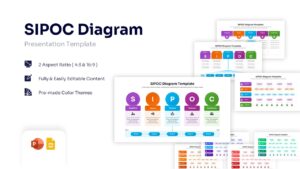
Optimizing supply chain operations or mapping out complex manufacturing procedures often leads to severe confusion without a standardized visual framework. Operations managers, quality assurance teams, and project leads desperately need a straightforward way to communicate these multifaceted workflows to stakeholders and executives. How can you successfully break down the intricate, vital relationships between external suppliers and end customers without losing your audience’s attention? The answer lies in leveraging dynamic SIPOC Diagram Template to clearly outline every critical phase of your project. By introducing this modern design equipped with creative structural blocks, presenters can instantly transform chaotic data into a streamlined, easy-to-follow visual narrative that guarantees immediate comprehension.
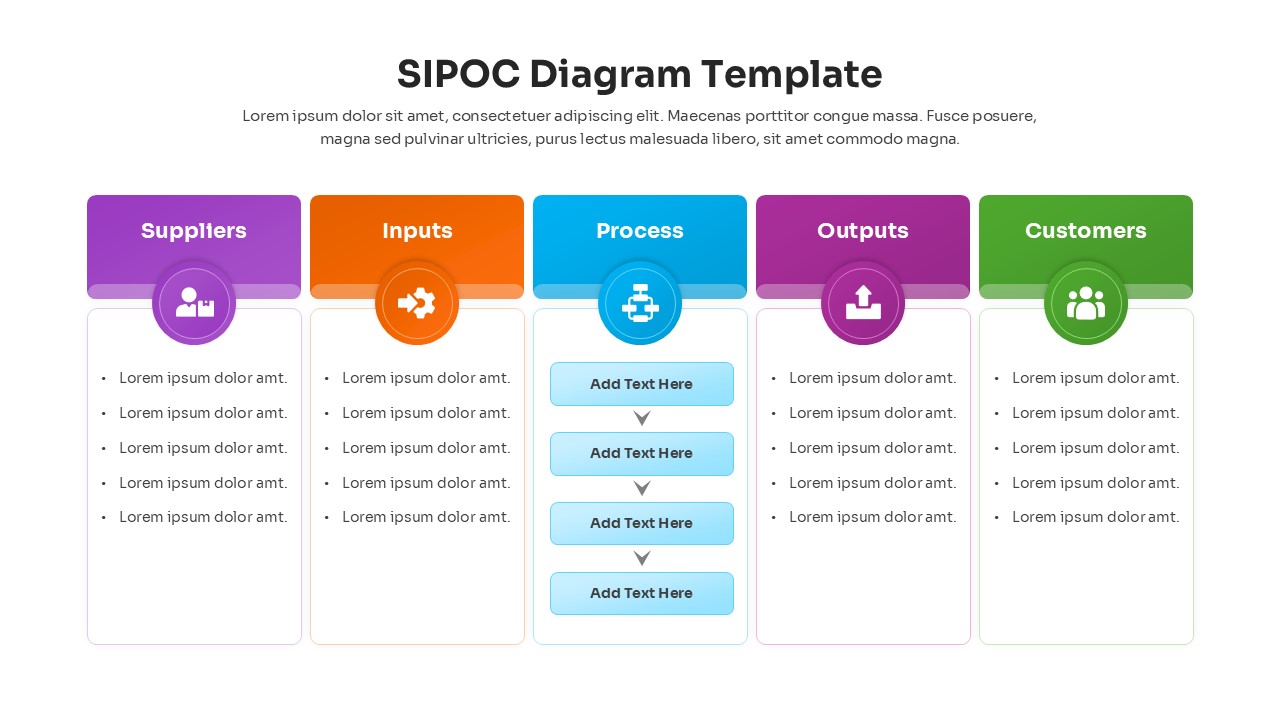
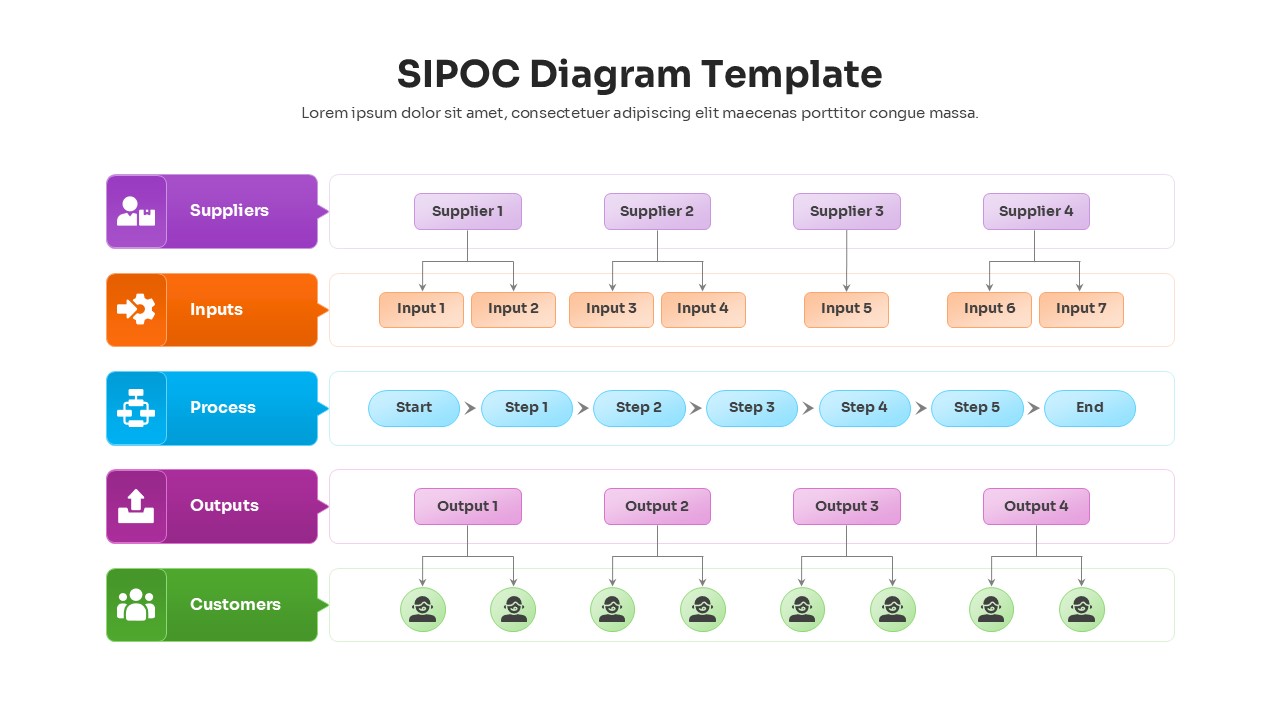
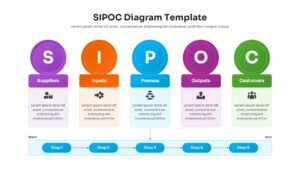
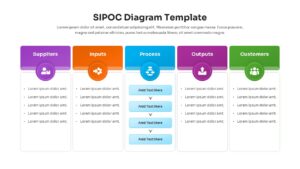
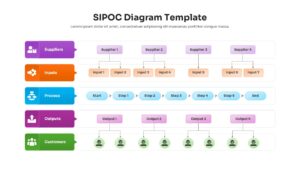
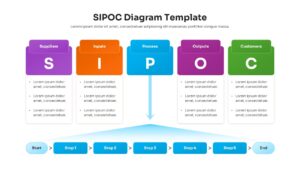
This SIPOC business strategy diagram carries a central, highly organized five-column structure, with each section distinctly color-coded in vibrant shades of purple, orange, blue, magenta, and green to perfectly represent Suppliers, Inputs, Process, Outputs, and Customers. The editable elements allow users to seamlessly modify bold circular headers, fully customizable text blocks for essential bullet points, and high-quality representative infographic icons denoting each operational stage. Several intelligent variations exist within the downloaded deck, offering everything from standard linear flowcharts to expansive hierarchical tree structures for deeper data dives. Presenters dealing with non-linear frameworks or continuous feedback systems can also utilize our specialized cycle and loop diagrams if they need to discuss ongoing iterations. Thus, professionals from nearly every business domain can download and customize this dynamic deck to streamline their next big management review. Try it now!
Key Features
- 100% Vector-Based Graphics
- Fully Layered & Organized
- Multi-Platform Support
- Theme Color & Theme Font
- Includes multiple hierarchical and linear layout variations
- Features five distinct, color-coded data columns
Frequently Asked Questions
- What is a SIPOC diagram used for?
- It is used to document a business process from beginning to end, helping teams identify all relevant elements—suppliers, inputs, process steps, outputs, and customers—before starting a project.
- Can I edit the column headers in this template?
- Yes, all text fields, including headers and descriptions, are fully editable in PowerPoint and Google Slides.
- Does this template support different color schemes?
- Absolutely. The template uses theme colors, so changing your presentation\'s color theme will automatically update the diagram\'s colors.
Related Templates
-
-
-
Free PESTLE Analysis Template
Business
Free -