Free 3D Iceberg Template for PowerPoint & Google Slides


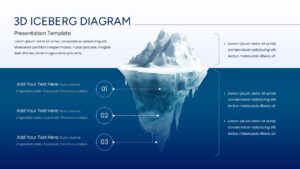
3D Iceberg Diagram for In-Depth Analysis
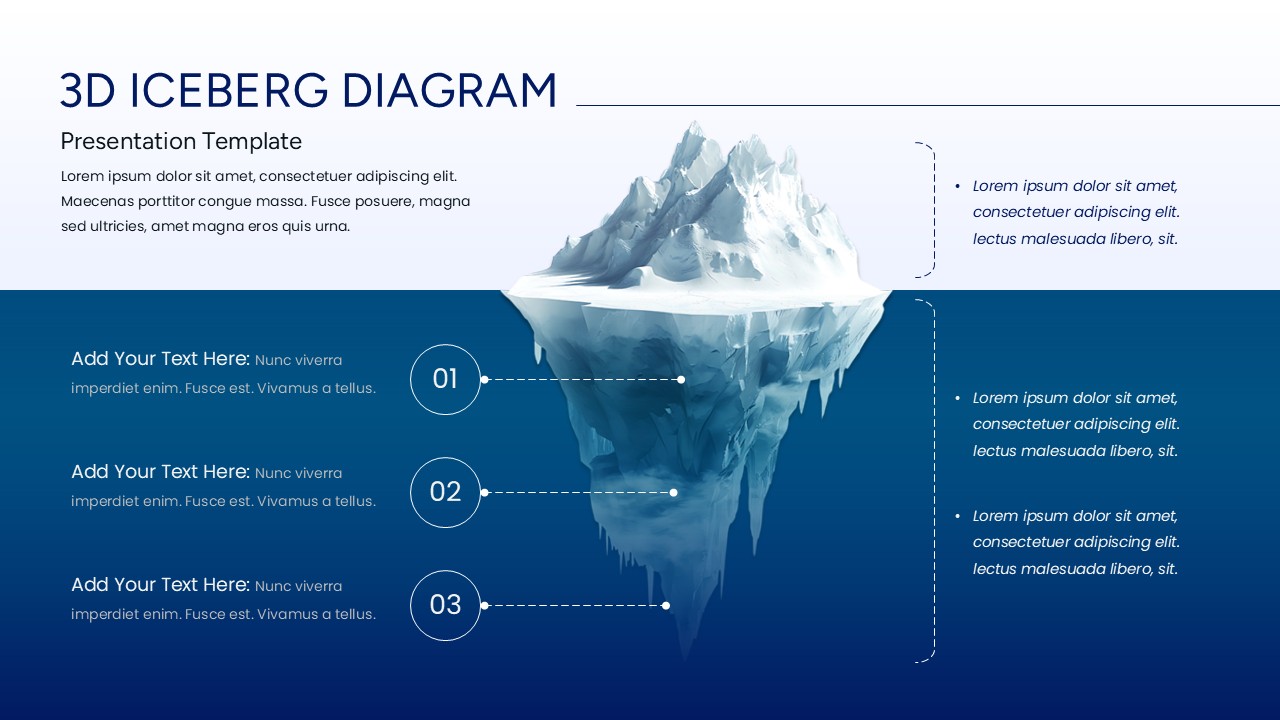
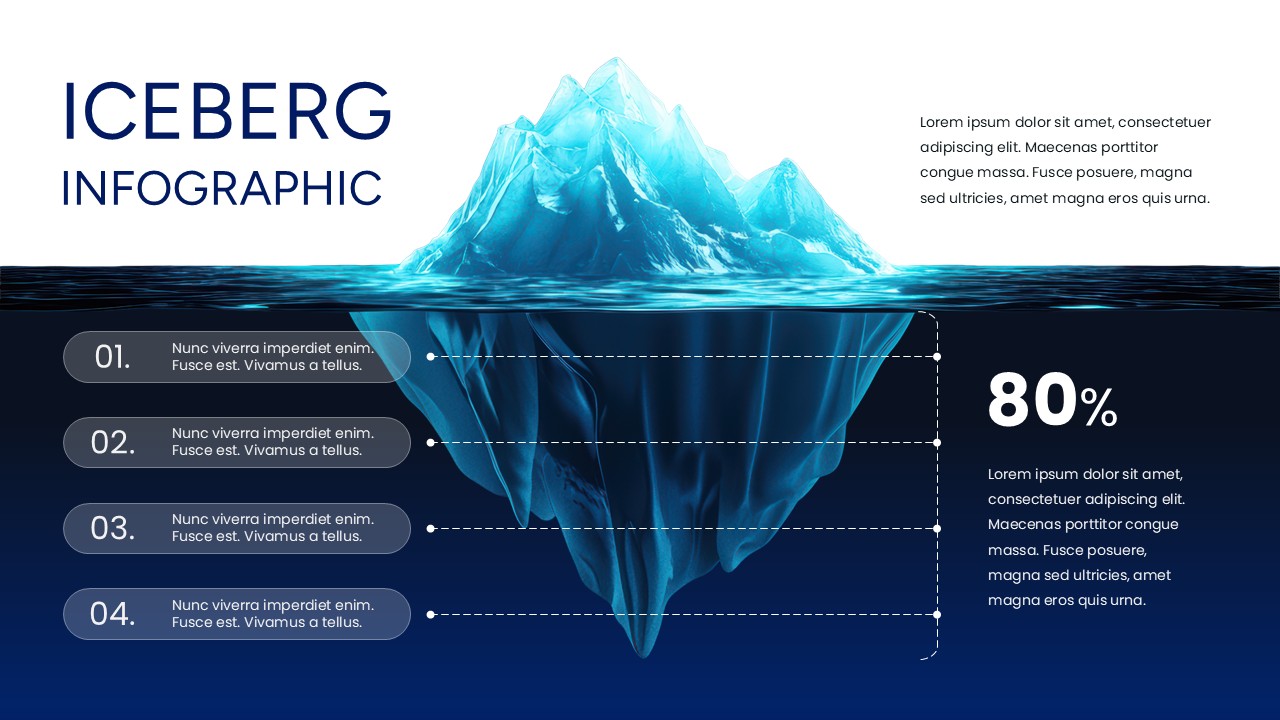
Download this Free 3D Iceberg Model Template for PowerPoint and Google Slides & visually articulate complex, multi-layered concepts with striking clarity. The high-definition, three-dimensional graphics bring a realistic underwater aesthetic to your slides, ensuring your audience remains captivated while absorbing intricate data. Whether you are mapping out corporate culture or designing highly detailed presentation models, this dynamic PowerPoint diagrams prevents viewer fatigue and elevates your professional narrative.
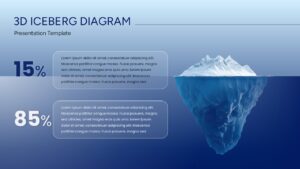
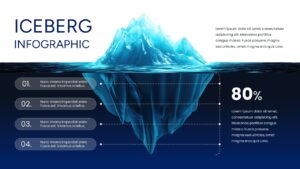
The iceberg theory, famously coined by Ernest Hemingway and adapted by psychologists like Sigmund Freud, posits that what is visible on the surface is merely a fraction of a much larger underlying structure. In modern corporate environments and psychological studies, this concept is crucial for understanding complex systems, organizational culture, or the root causes of underlying issues. Effective problem-solving relies on looking past the immediate, visible symptoms—often representing just 10% to 15% of the situation—to address the massive hidden mass beneath the surface. Analyzing these submerged factors, such as hidden operational costs, subconscious consumer behaviors, or foundational market dynamics, is essential for comprehensive strategic planning. However, without a compelling visual aid, communicating these unseen obstacles is incredibly difficult, leaving organizations vulnerable to unseen risks that silently hinder long-term progress.
This is exactly where our Free 3D iceberg model template becomes an invaluable asset—it brings those hidden factors into the light. By visually mapping the contrast between what is immediately obvious and what lies beneath the surface, the cause and effect analysis template transforms vague, abstract concerns into a concrete and actionable discussion.
Key Features
- 100% Vector-Based Graphics
- Fully Layered & Organized
- Multi-Platform Support
- Theme Color & Theme Font
Frequently Asked Questions
- How do I edit the text in the 3D iceberg sections?
- Simply click on any text placeholder or numbered bubble to type your own content. The layout is fully unlocked for easy customization.
- Can I change the percentage values on the slides?
- Yes, all numbers and percentages are text-based, allowing you to update them to match your specific data or research findings.
- Is this template compatible with Keynote?
- While designed for PowerPoint and Google Slides, you can import the .pptx file into Keynote, though some minor formatting adjustments may be needed.
Related Templates
-
 Free
Free -
 Free
Free -
-