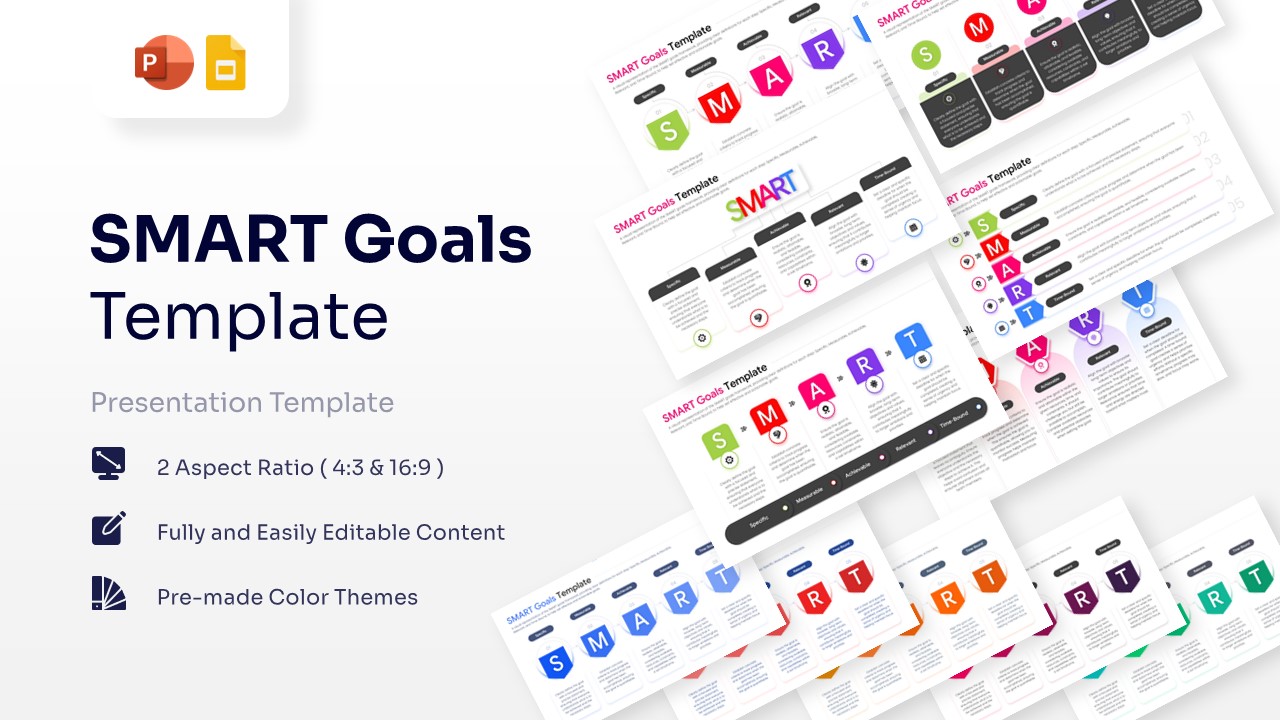
Free Euler Diagram Template for PowerPoint & Google Slides
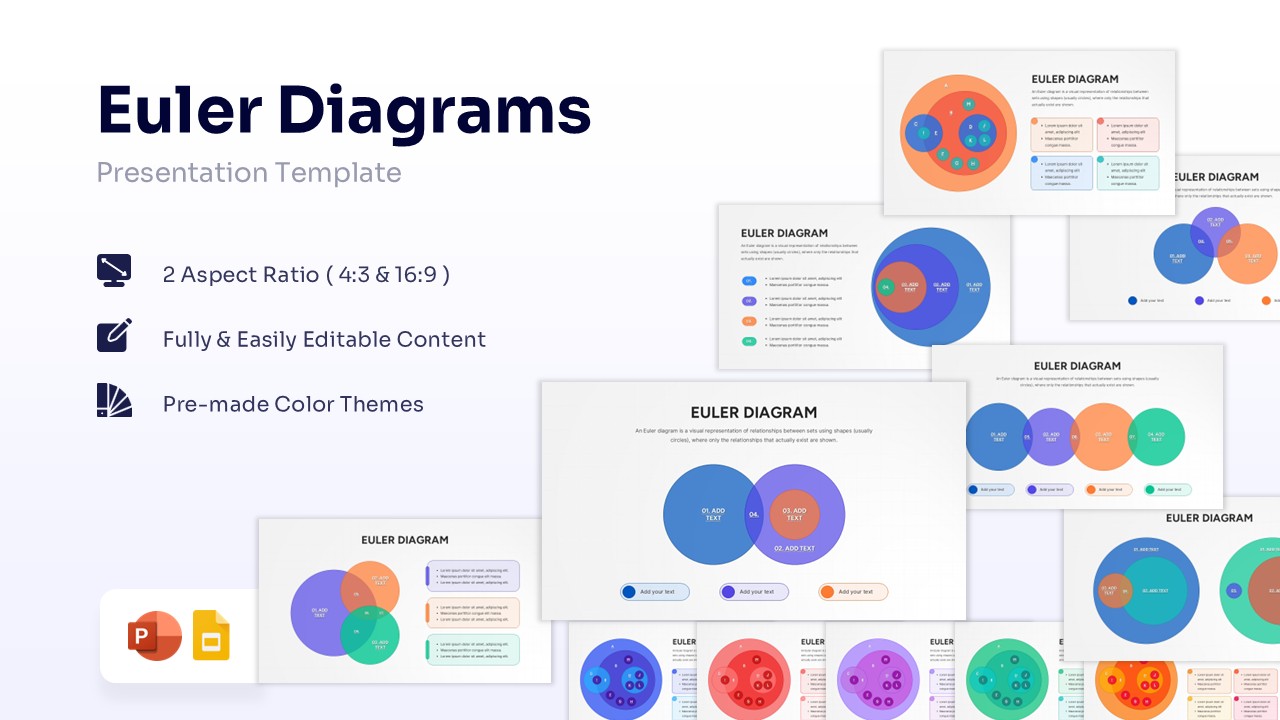


Editable Euler Diagram
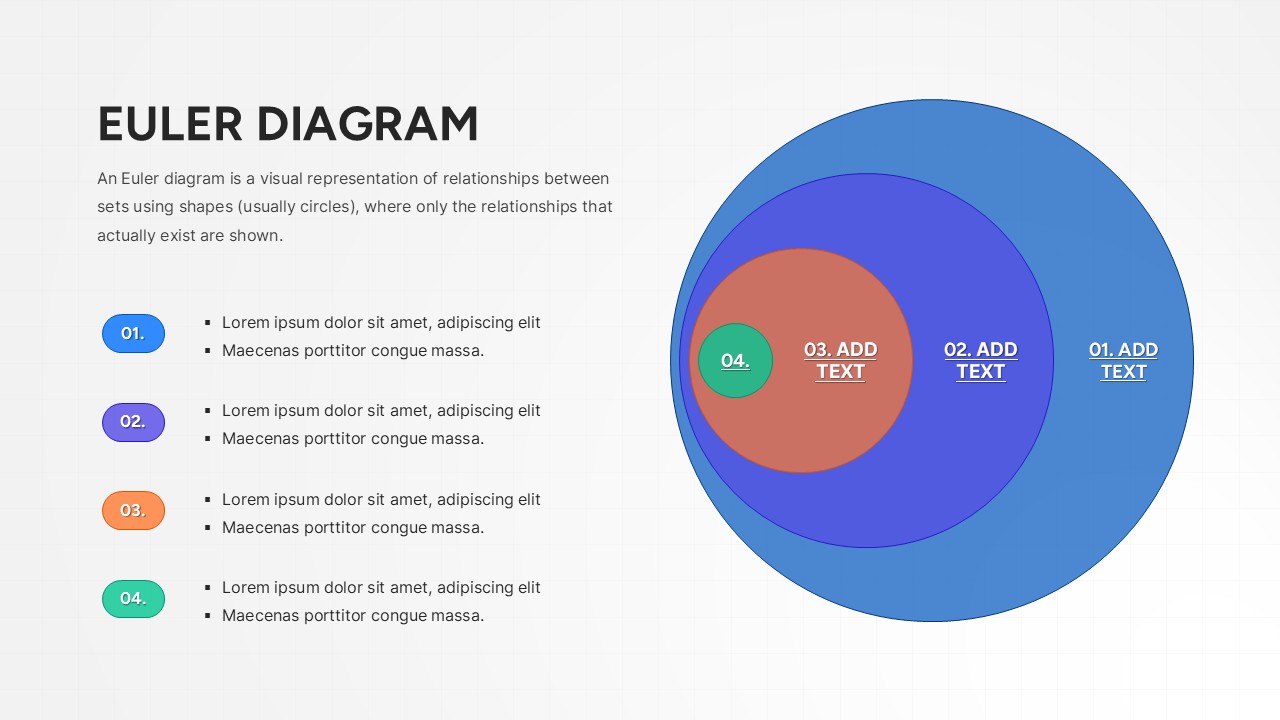
Understanding intricate data relationships is the key to success in analytical presentations. Highlighting these connections visually helps your audience grasp complex logic instantly, which is why using a Free Euler Diagram Template is essential.
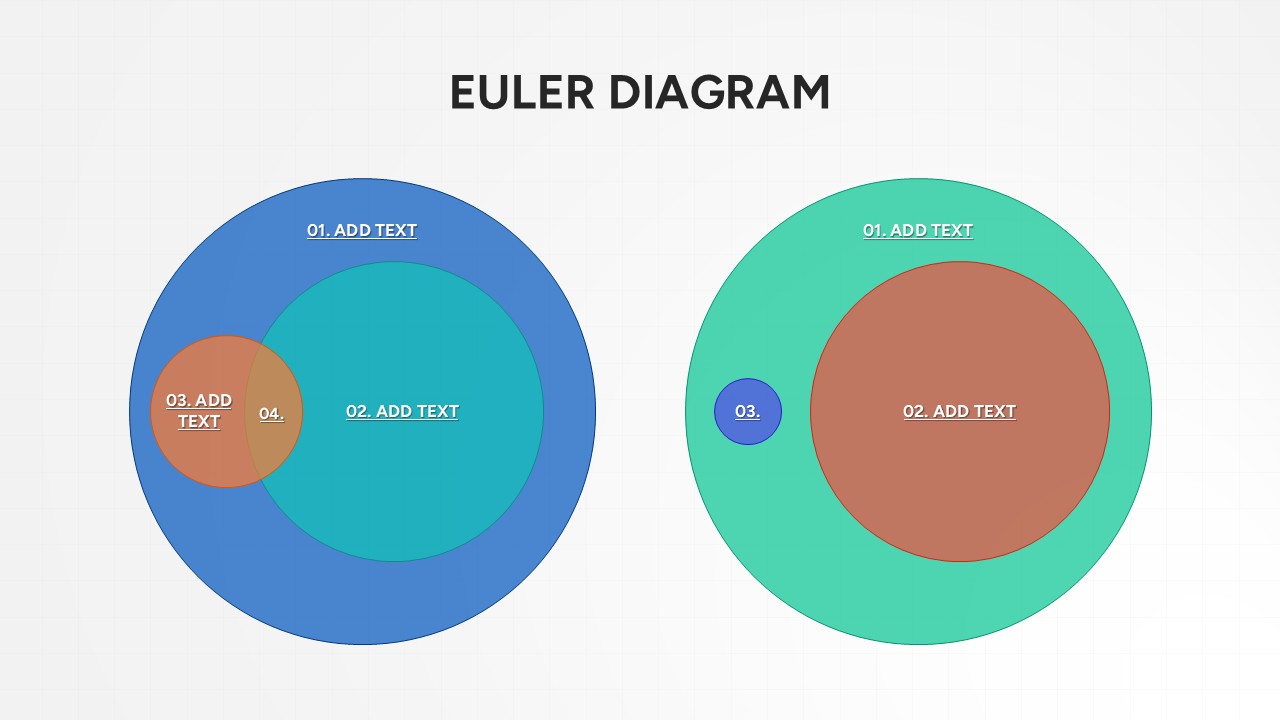
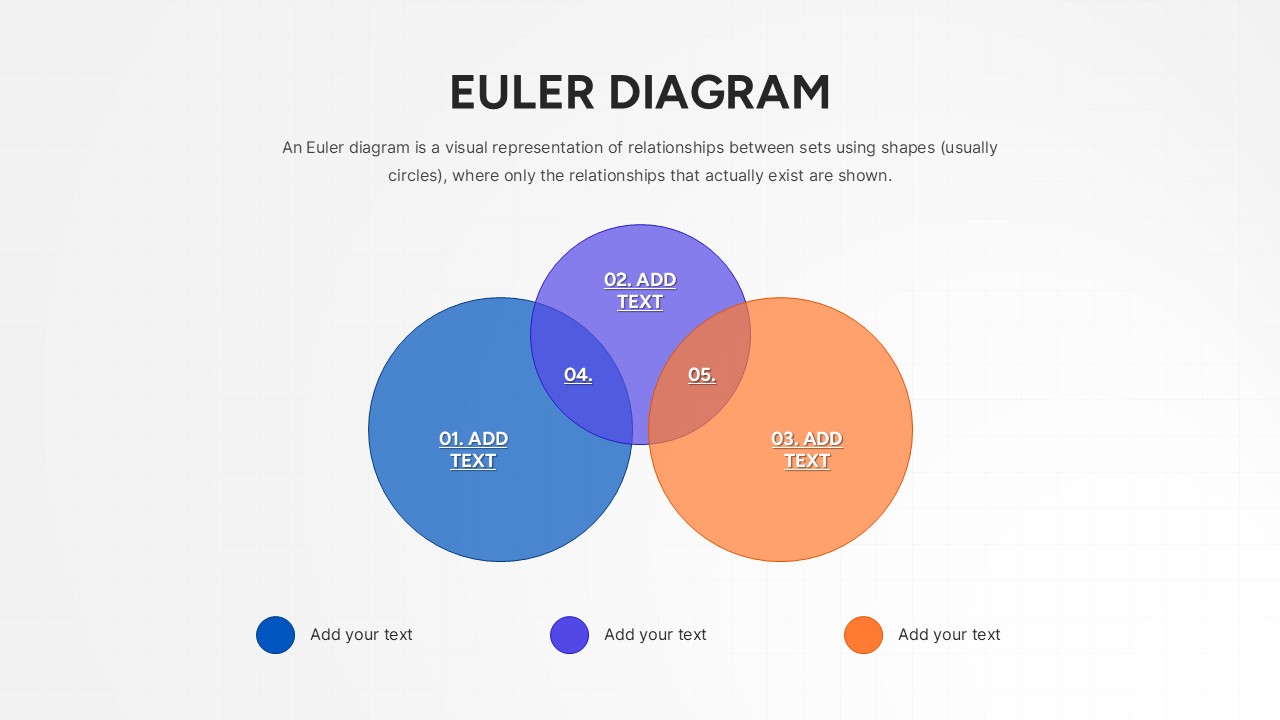
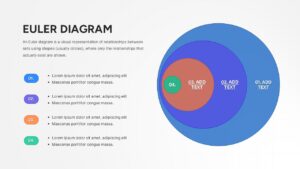
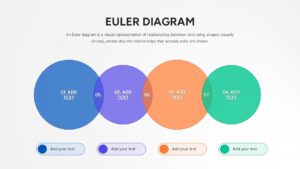
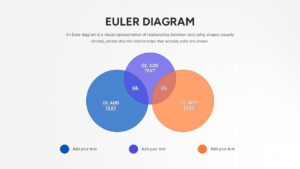
Now mapping logical relationships is easier than ever to create with this aesthetically pleasing Euler Diagrams. This circular diagram helps individuals to visualize sets using easy-to-edit overlapping circles, nested shapes, horizontal sequences, and detailed text placeholders.
So, whether you are planning to compare business metrics or just want to make a clear educational presentation, this Editable Euler Diagrams will be perfect for you. So, release your inner designer and let your creativity soar with this amazing Logical Set Diagrams.
Don’t forget to checkout out our professional data visualization templates for some amazing designs.
Key Features
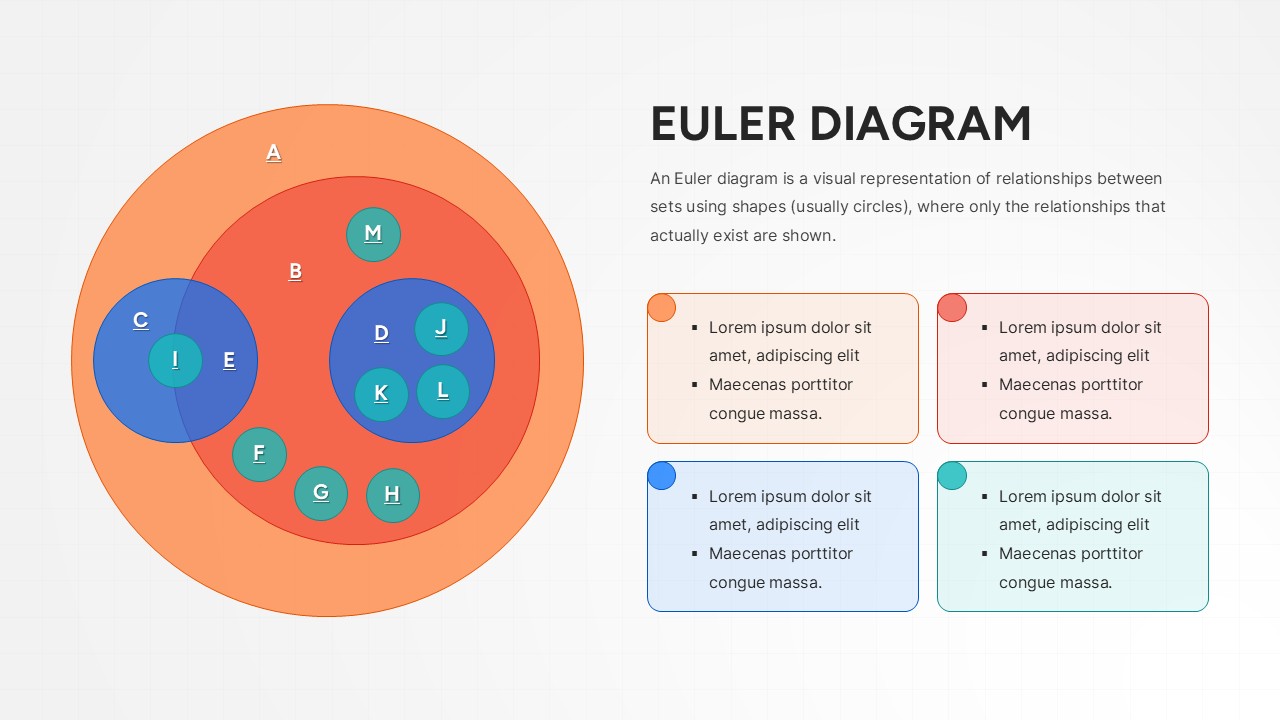
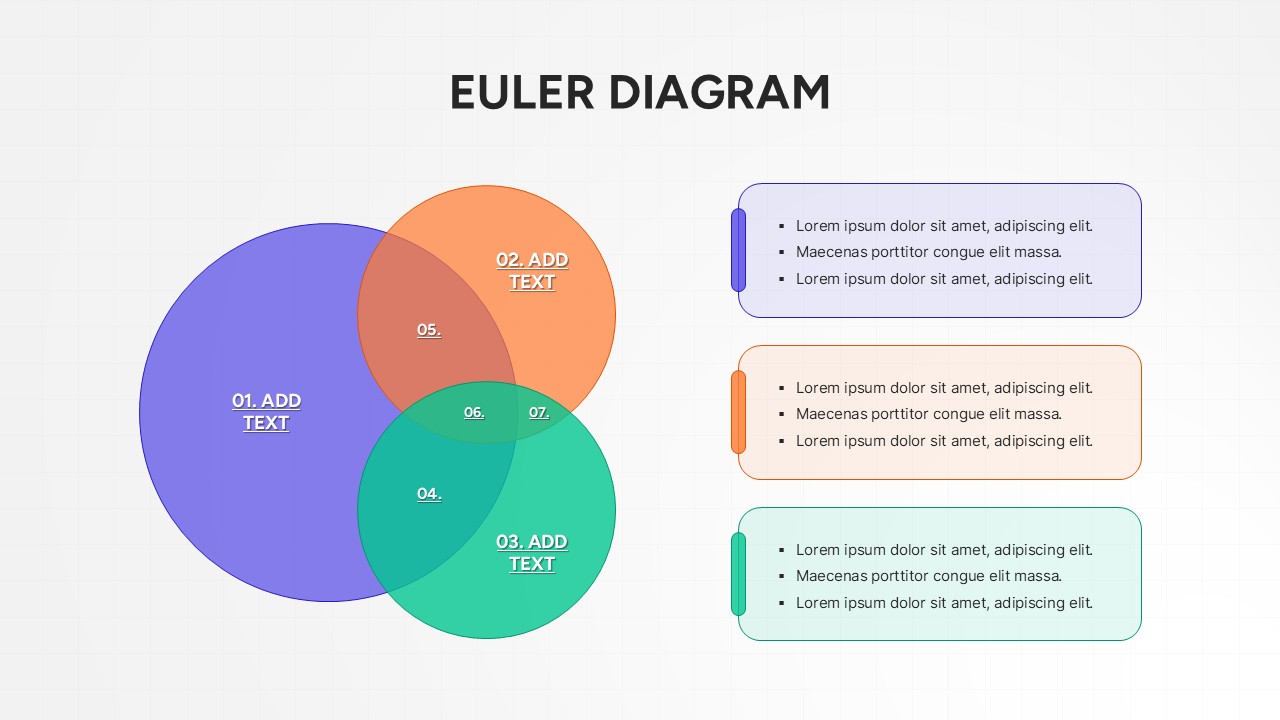
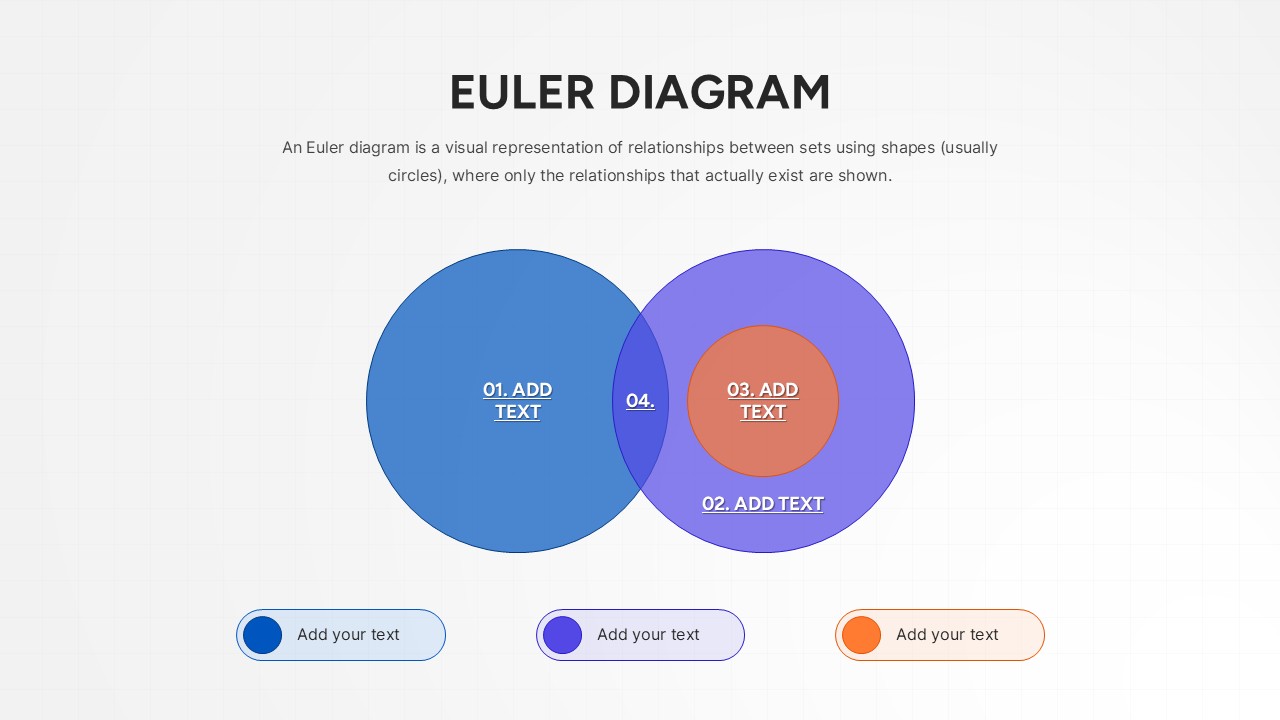
- Diverse layout options including 2, 3, and 4-circle diagrams.
- Fully editable shapes, colors, and fonts for complete customization.
- Clean, vector-based graphics that maintain quality when resized.
- Includes concentric, overlapping, and linear diagram styles.
Frequently Asked Questions
- What is the difference between a Euler Diagram and a Venn Diagram?
- A Venn diagram shows all possible logical relationships between sets, whereas a Euler diagram shows only the relationships that actually exist in the real world context you are presenting.
- Can I change the number of circles?
- Yes, the shapes are fully editable. You can ungroup elements to add or remove circles to fit your specific data requirements.
- Is this template compatible with Google Slides?
- Absolutely. This template is designed to work seamlessly in both Microsoft PowerPoint and Google Slides.