Monthly Business Review Free Presentation Template for PowerPoint & Google Slides


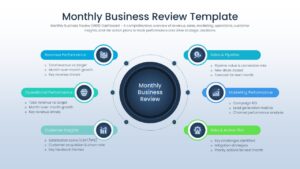
Comprehensive MBR Dashboard Template for Corporate Success
Regular business reviews are essential for measuring progress, identifying opportunities, and making informed decisions. Organizations that consistently track performance metrics and strategic goals can achieve better outcomes with a structured business performance dashboard presentation. Download this free Monthly Business Review Template and use case for tracking revenue, sales, marketing, and operational health in one centralized location. This professional business presentation deck helps leadership teams visualize complex data sets with clarity and professional flair. The clean layout ensures your audience stays focused on key insights during high-stakes executive meetings.
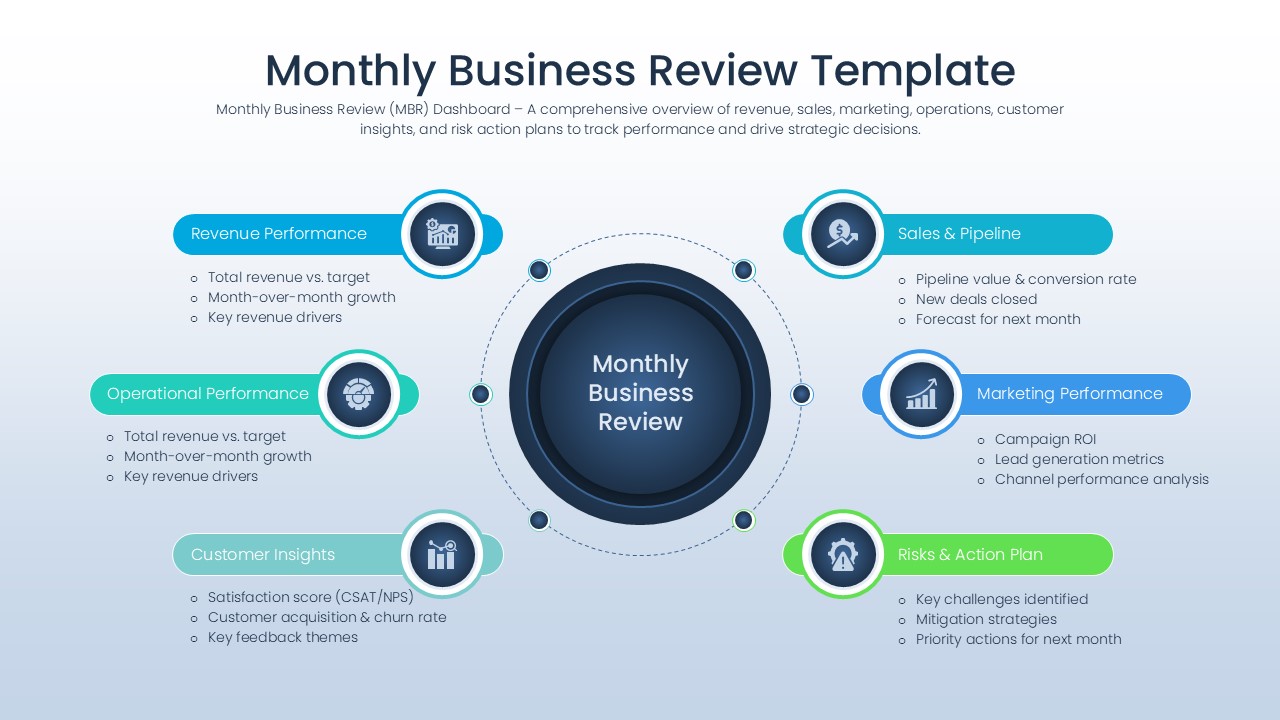
Now reviewing business performance is easier than ever to create with this aesthetically pleasing Monthly Business Review Template. This MBR Dashboard Template helps individuals to analyze performance, monitor KPIs, present insights, and track progress using easy-to-edit executive dashboards, KPI scorecards, performance charts, and business review reports.
So, whether you are planning to present monthly performance updates to stakeholders or just want to make a professional executive reporting presentation, this Business Review Presentation will be perfect for you. So, release your inner designer and let your creativity soar with this amazing Monthly Performance Review.
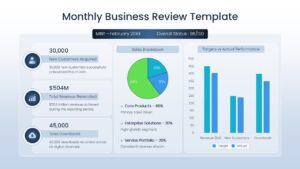
Every element is a vector graphic, meaning you can recolor icons and charts to match your corporate branding without losing any image quality. You can easily modify these fully editable data visualization slides to signify different performance tiers or department-specific metrics. This level of customizability ensures that your geographic and financial data is always presented in a logical and visually appealing manner.
This MBR Dashboard Template is ideal for executives, operations managers, project managers, financial analysts, and sales leaders. It supports corporate performance reviews, monthly operations reports, strategic planning, and business performance tracking.
Why Use these Business Metrics Slides – Monthly Operations Report
- Provides a clear visual representation of KPIs to improve audience retention and understanding.
- Reduces preparation time by using pre-designed layouts for financial statistics and location markers.
- Ensures a professional look with a consistent design language across all corporate reporting slides.
- Allows for high levels of customization to highlight specific market trends or internal growth zones.
Who Should Download this MBR Dashboard Template – Corporate Performance Review
- Executive Leadership and CEOs tracking overall company health and strategic milestones.
- Operations Managers and Department Heads needing to report monthly progress to stakeholders.
- Project Managers overseeing complex integrations, migrations, or app development lifecycles.
- Financial Analysts and Sales Directors focusing on revenue drivers and pipeline health.
Browse our Free Infographics Template Library for additional editable infographic layouts and presentation resources.
Key Features
- 100% Vector-Based Graphics
- Fully Layered & Organized
- Multi-Platform Support
- Theme Color & Theme Font
- Data-driven Excel linked charts
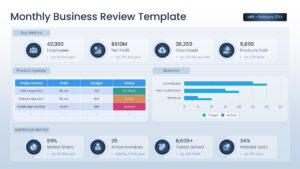
- Professional KPI dashboard layout
Frequently Asked Questions
- How can I customize the Monthly Business Review charts?
- Every chart is fully editable; simply right-click the data visualization elements in PowerPoint or Google Slides to adjust values, colors, and labels to match your specific report.
- Is this template suitable for a high-level executive meeting?
- Yes, the design is specifically tailored for professional environments, featuring a clean, minimalist aesthetic that prioritizes data clarity and high-level strategic overviews.
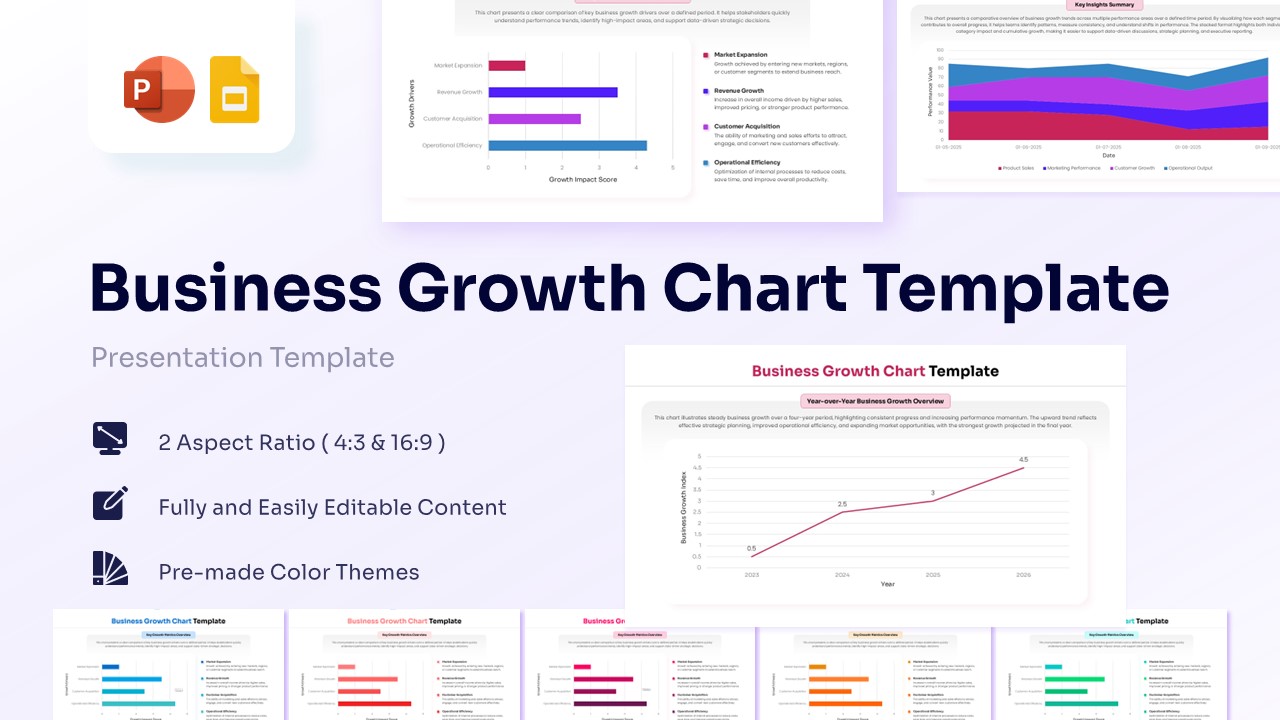
- Does this template support both 4:3 and 16:9 aspect ratios?
- Yes, the template is optimized for both standard and widescreen formats to ensure it fits perfectly on any projector or monitor screen.
Related Templates
-
 Free
Free -
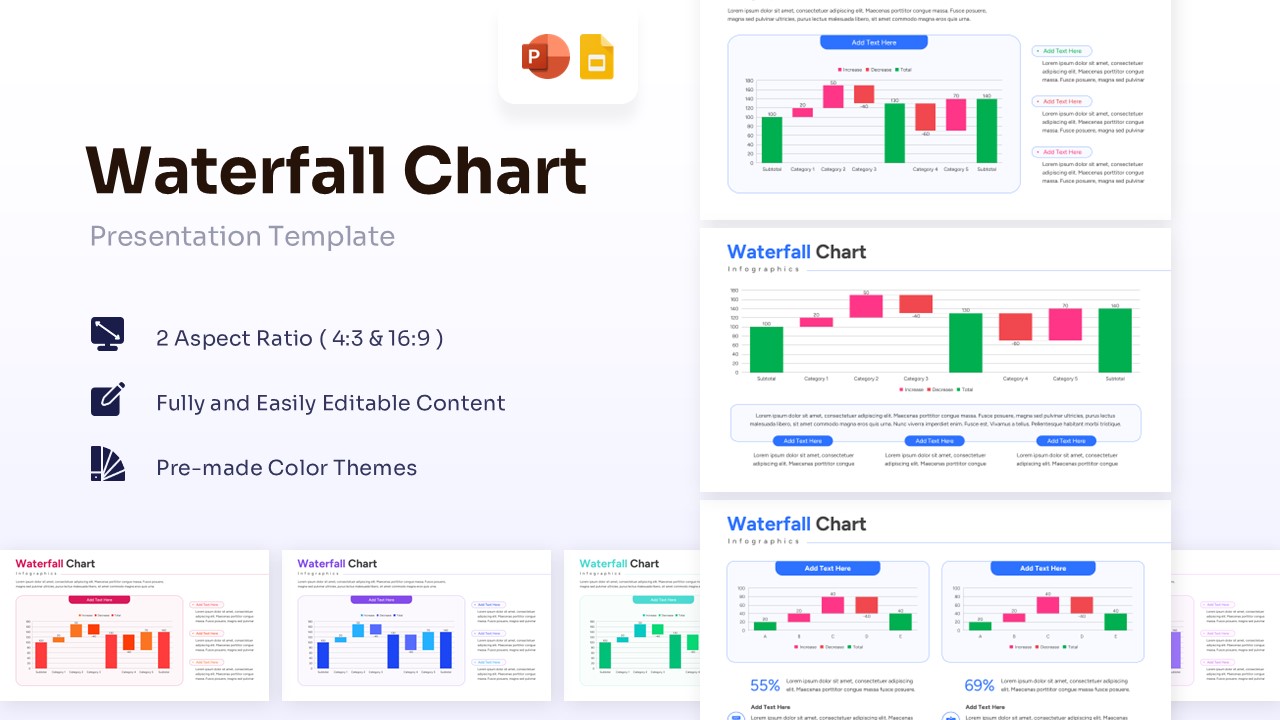
Free Waterfall Chart Template for PowerPoint & Google Slides
Bar and Column
Free -
-
 Free
Free