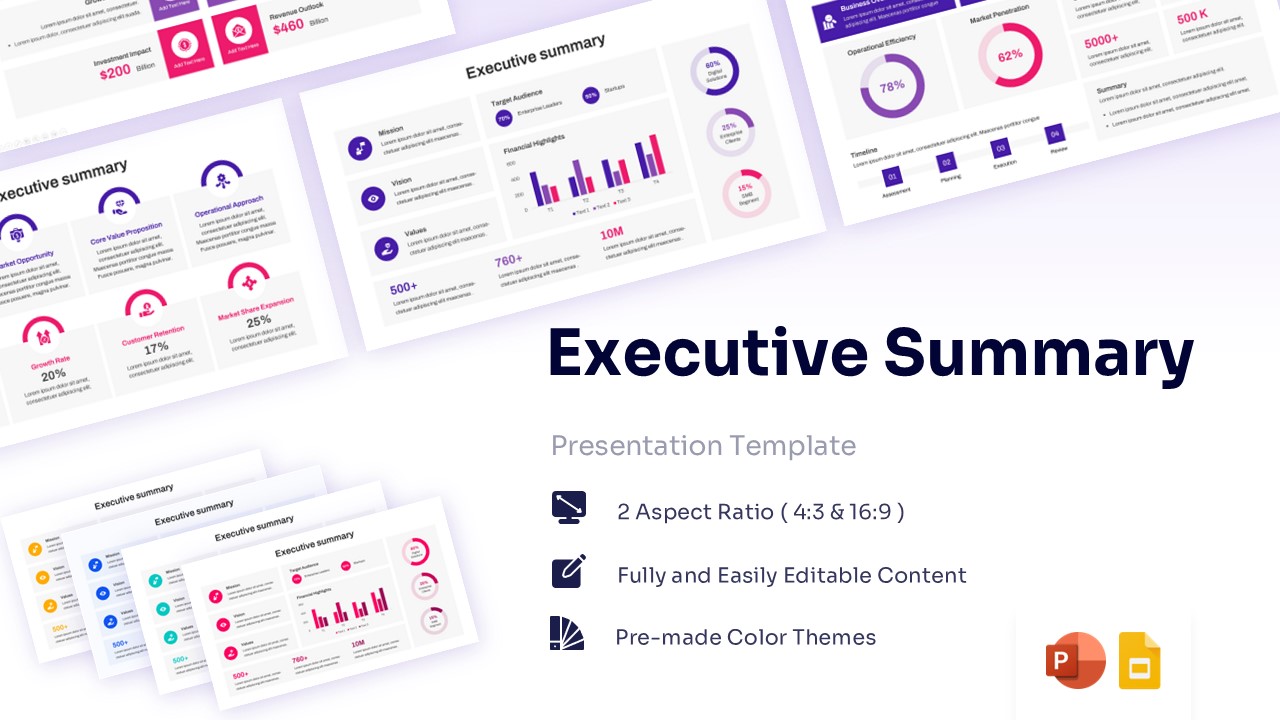
Free Cost Structure Infographics Template for PowerPoint & Google Slides
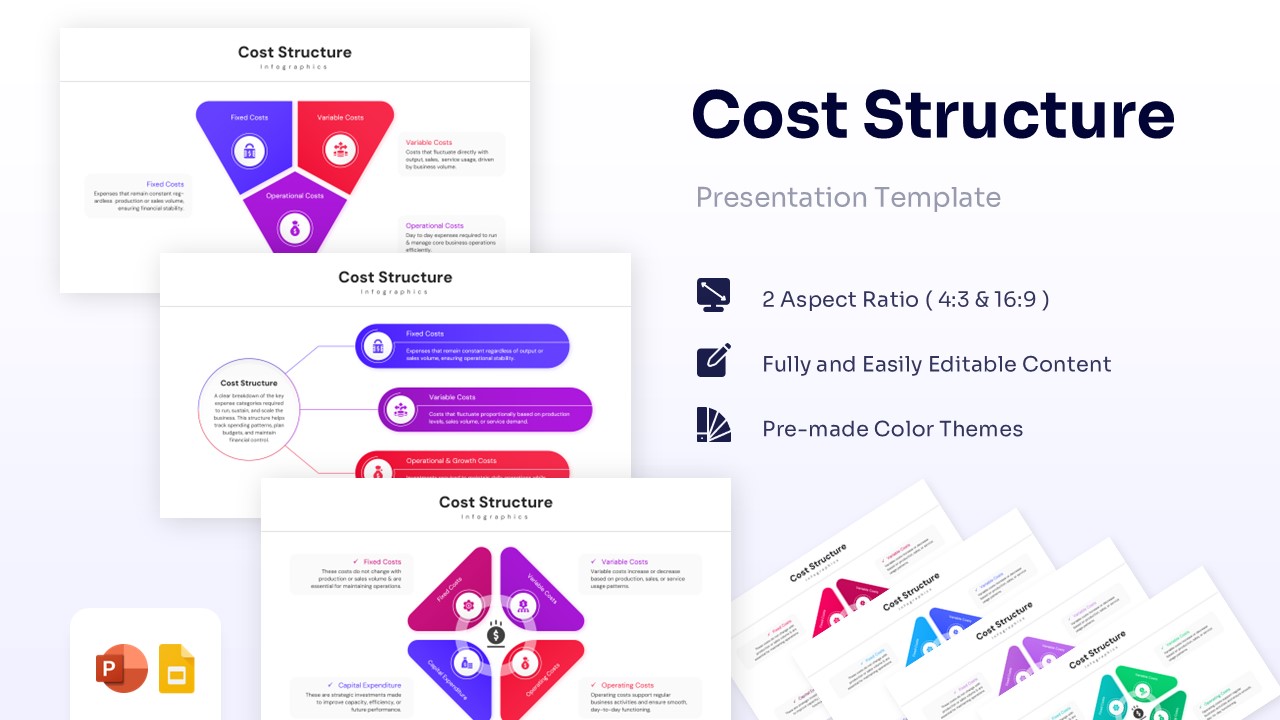


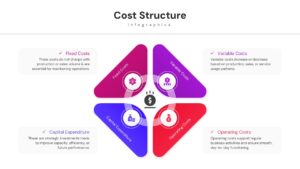

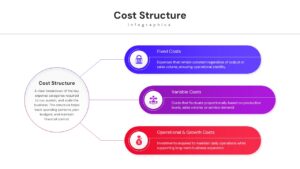
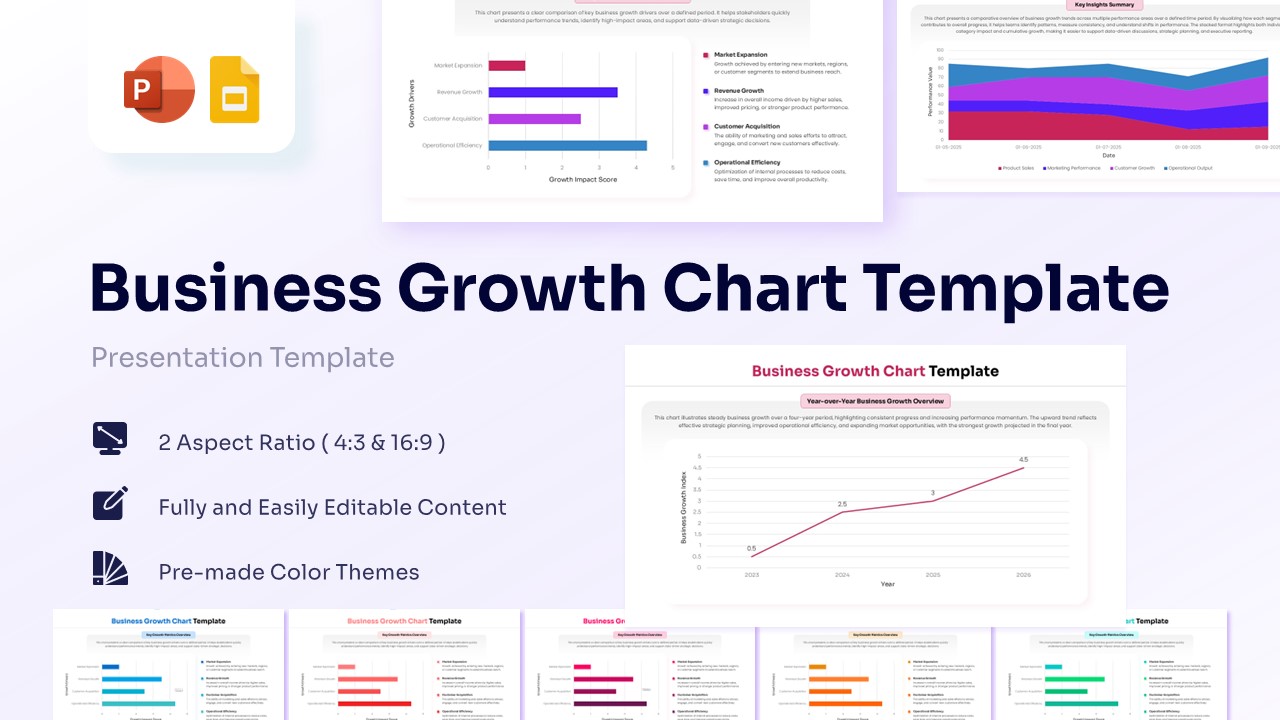
Financial Expense Breakdown Presentation Template
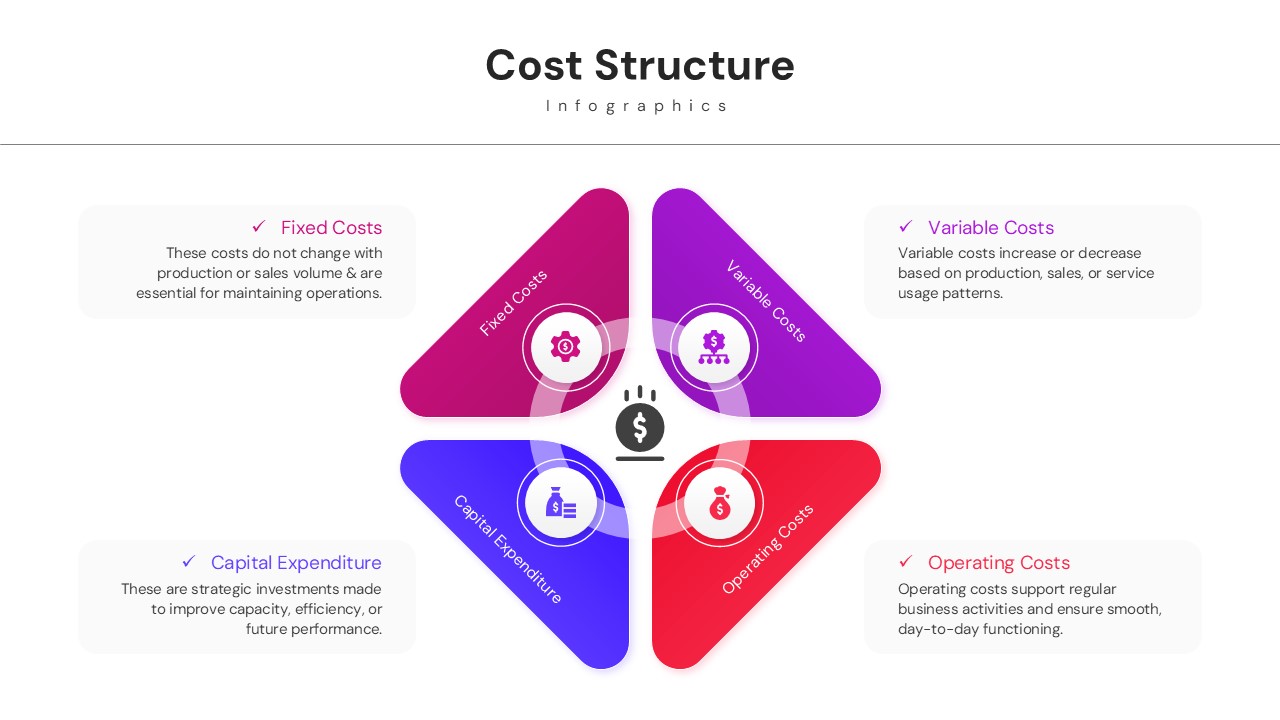
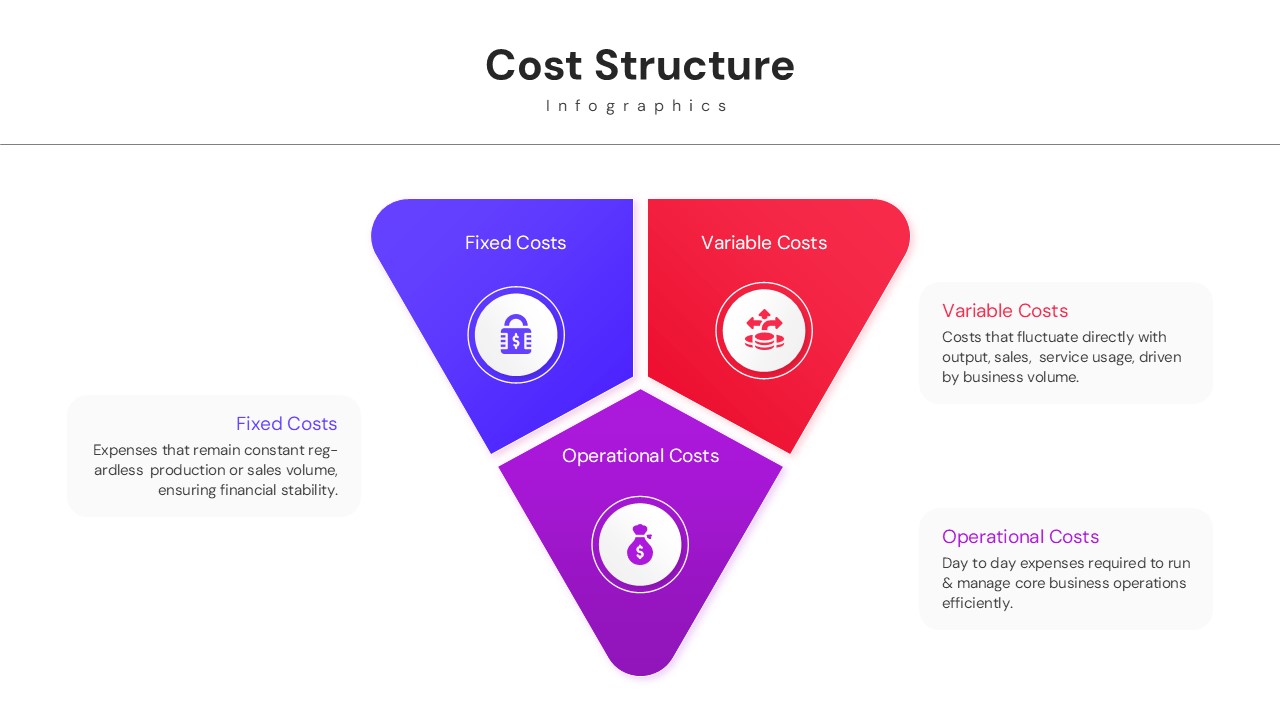
Elevate your financial reporting with the Free Cost Structure Infographics. This financial infographic slide layout simplifies expense categorization, budget tracking, and investment analysis into a highly visual, easy-to-digest format. It is the perfect tool for finance teams and corporate leaders needing to present complex fiscal data, seamlessly integrating with our broader collection of business strategy pitch decks for a complete organizational overview. Fully customizable and compatible with PowerPoint, Keynote, and Google Slides for effortless integration into your next big meeting.
Key Features
- 100% Vector-Based Graphics
- Fully Layered & Organized
- Multi-Platform Support
- Theme Color & Theme Font
- 2 Aspect Ratios (4:3 & 16:9)
Frequently Asked Questions
- Can I change the currency symbols in the icons?
- Yes, all icons and text are fully editable, so you can swap symbols or text to match your local currency.
- Is this compatible with Keynote?
- While designed for PowerPoint and Google Slides, the elements are standard vectors that can often be imported into Keynote with minor adjustments.
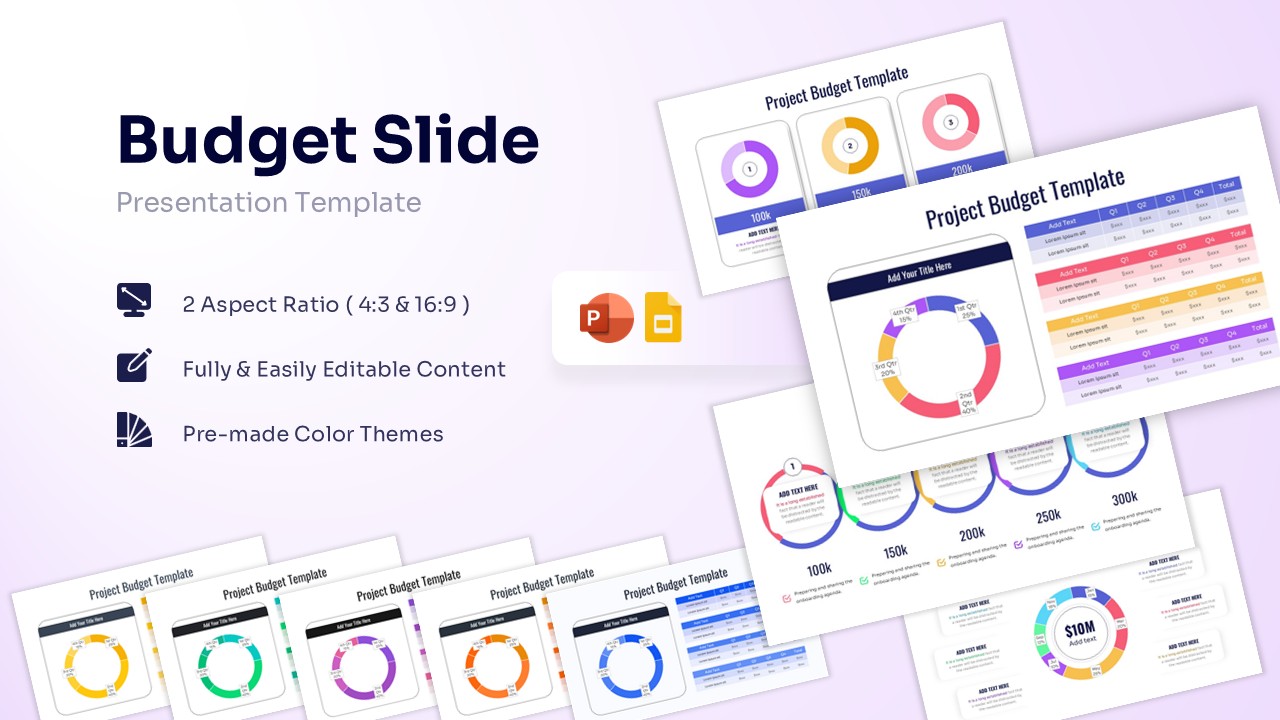
Related Templates
-
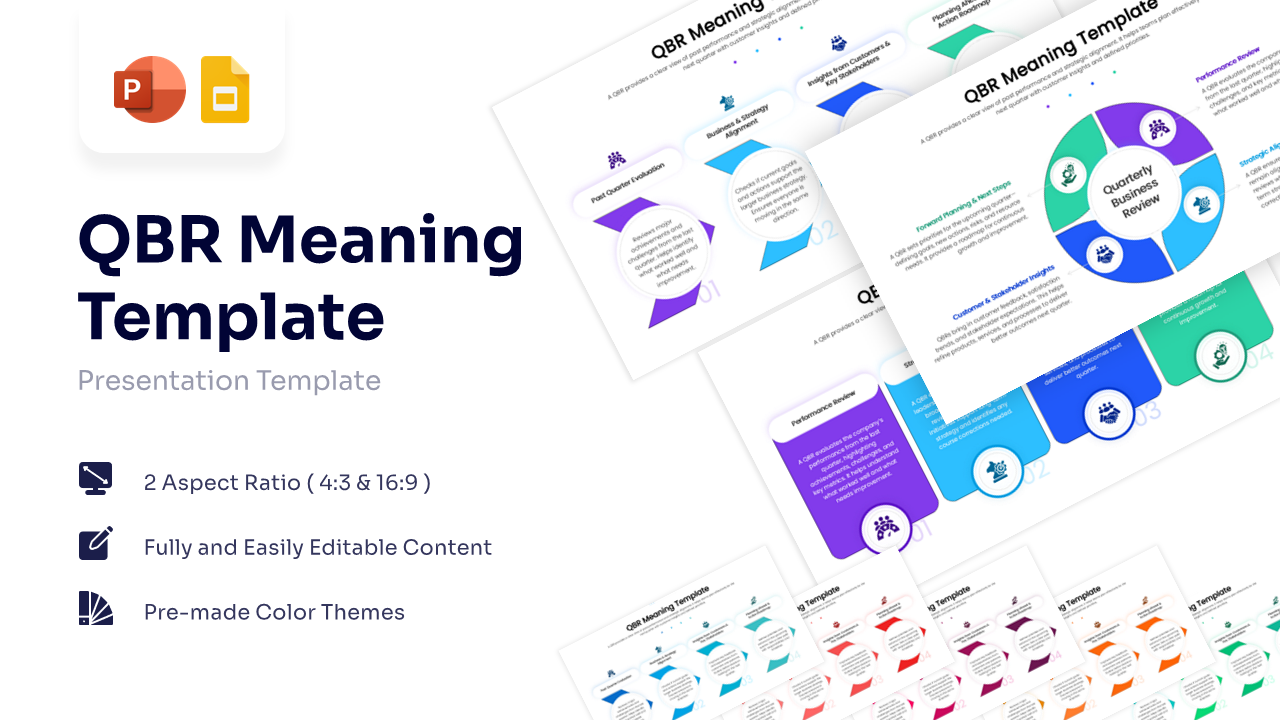
Quarterly Business Review Infographic
Annual Report
Free -
 Free
Free -
 Free
Free -