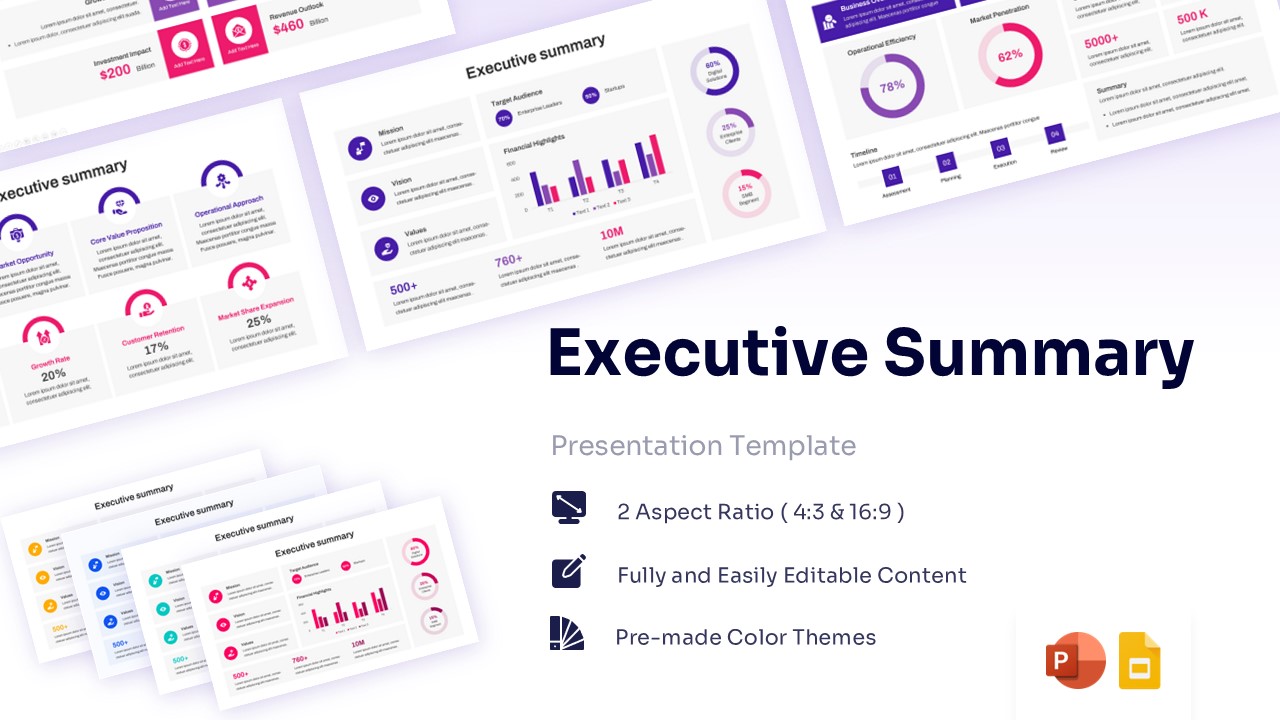
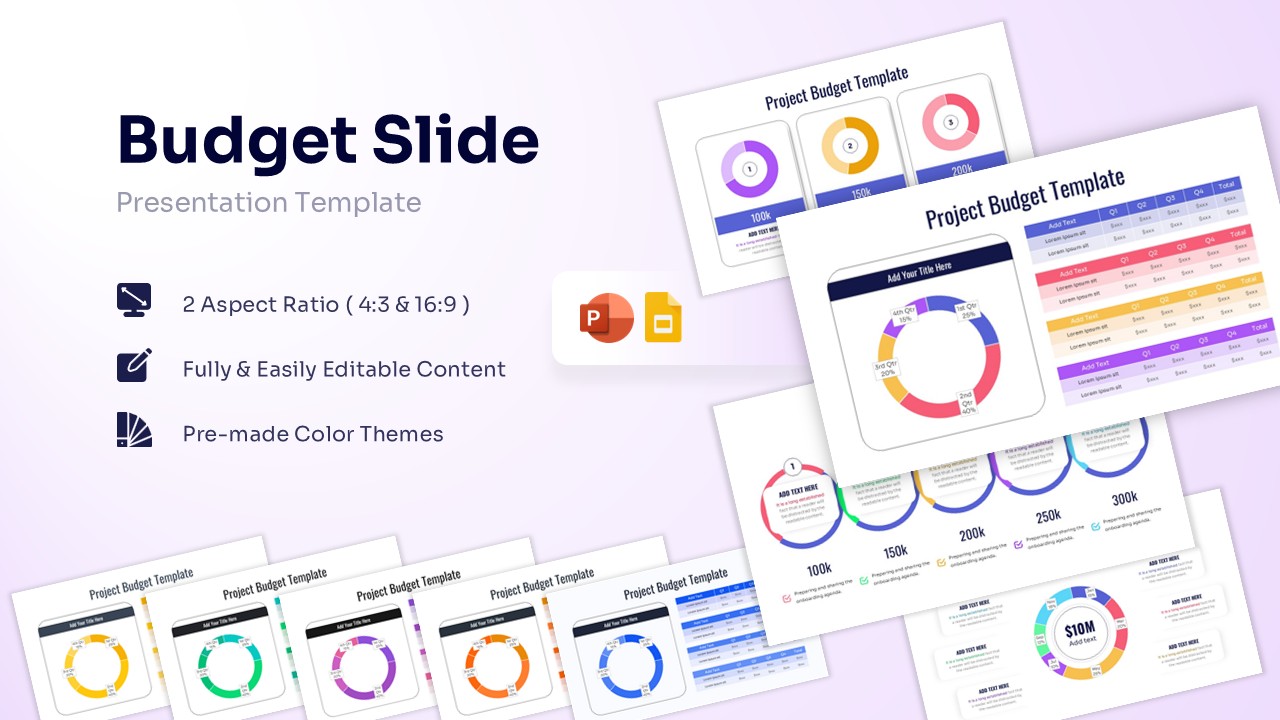
Free Project Budget Presentation Template for PowerPoint & Google Slides


Professional Financial Budget Google Slides and PowerPoint
Pitching a comprehensive financial plan to a board of directors or stakeholders requires absolute clarity and zero confusion. Keeping everyone aligned on quarterly expenditures and expected ROIs is made easier with our Free Project Budget Presentation Template. Whether you are addressing investors, financial officers, or internal project managers, displaying dense financial data can often cause the audience to lose focus. How can you ensure that your critical funding limits and resource distribution remain engaging and easy to digest? By utilizing a structured layout, presenters can easily incorporate clear financial summary infographics to break down complex figures. The modern, clean design of these slides acts as the perfect vehicle to deliver your financial strategy effectively.
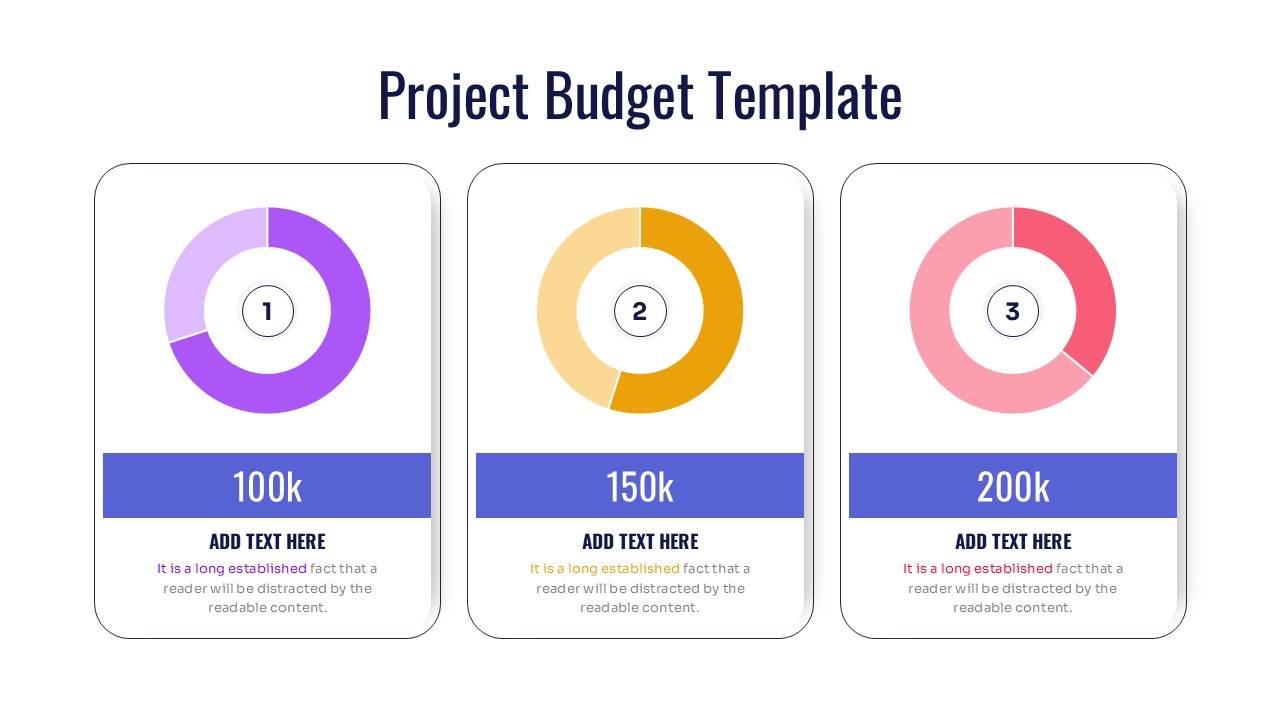
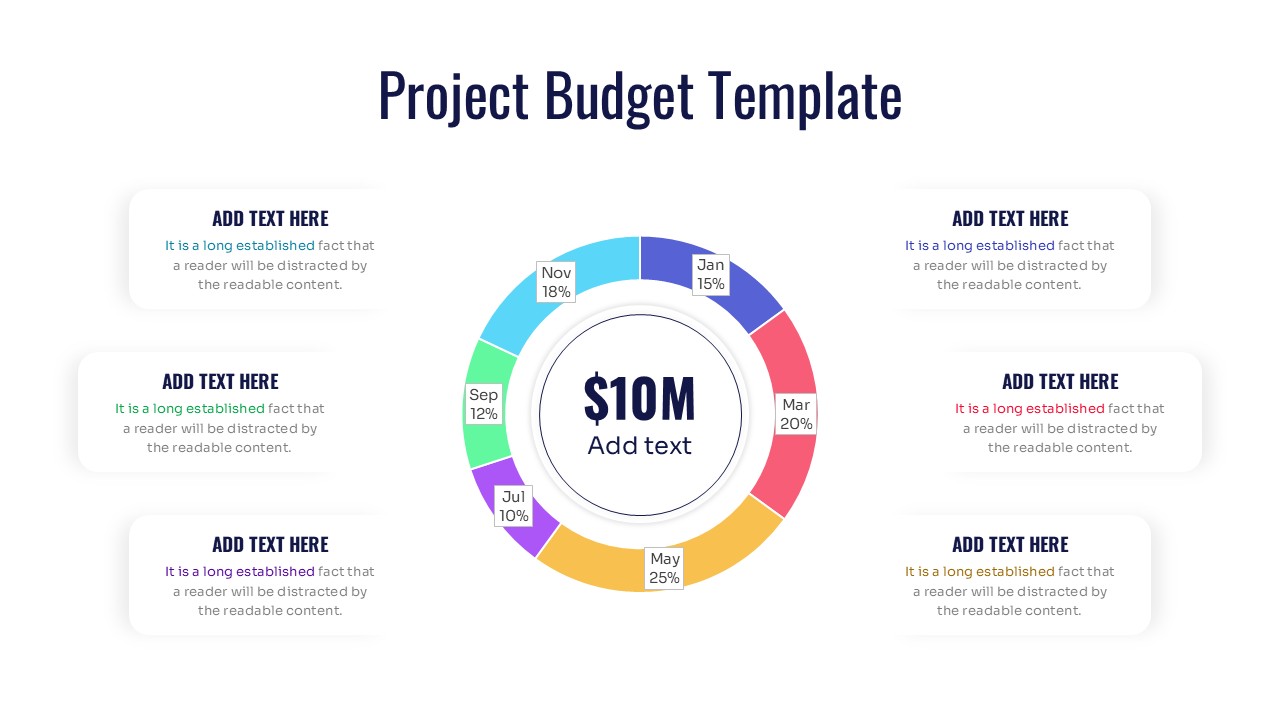
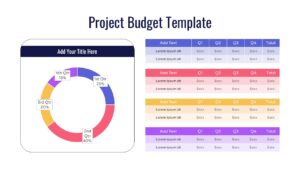
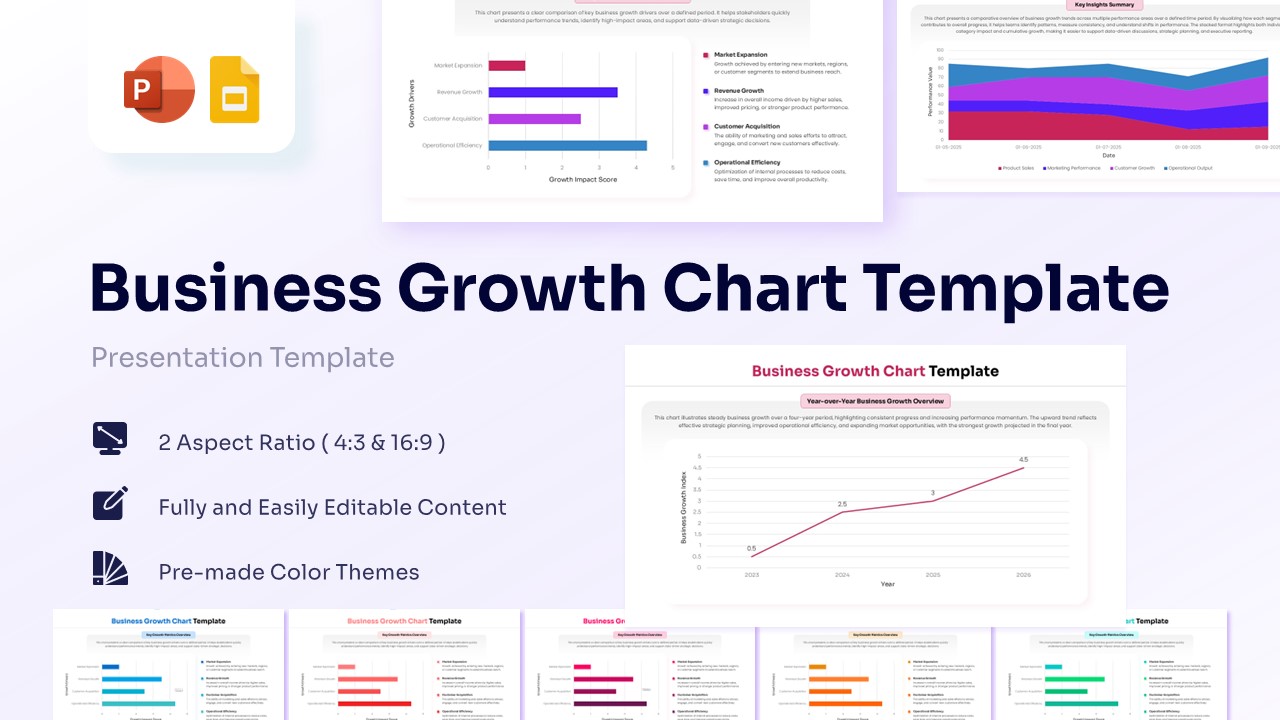
This Project Budget Plan deck provides a series of visually distinct layouts to capture every angle of your financial planning. One slide features a prominent, multi-colored donut chart broken down by specific months, wrapping around a bold central text placeholder ideal for a large metric like total budget. Another slide offers a side-by-side comparison with a quarterly donut chart on the left and neatly organized, color-coded data tables on the right for precise dollar amounts.
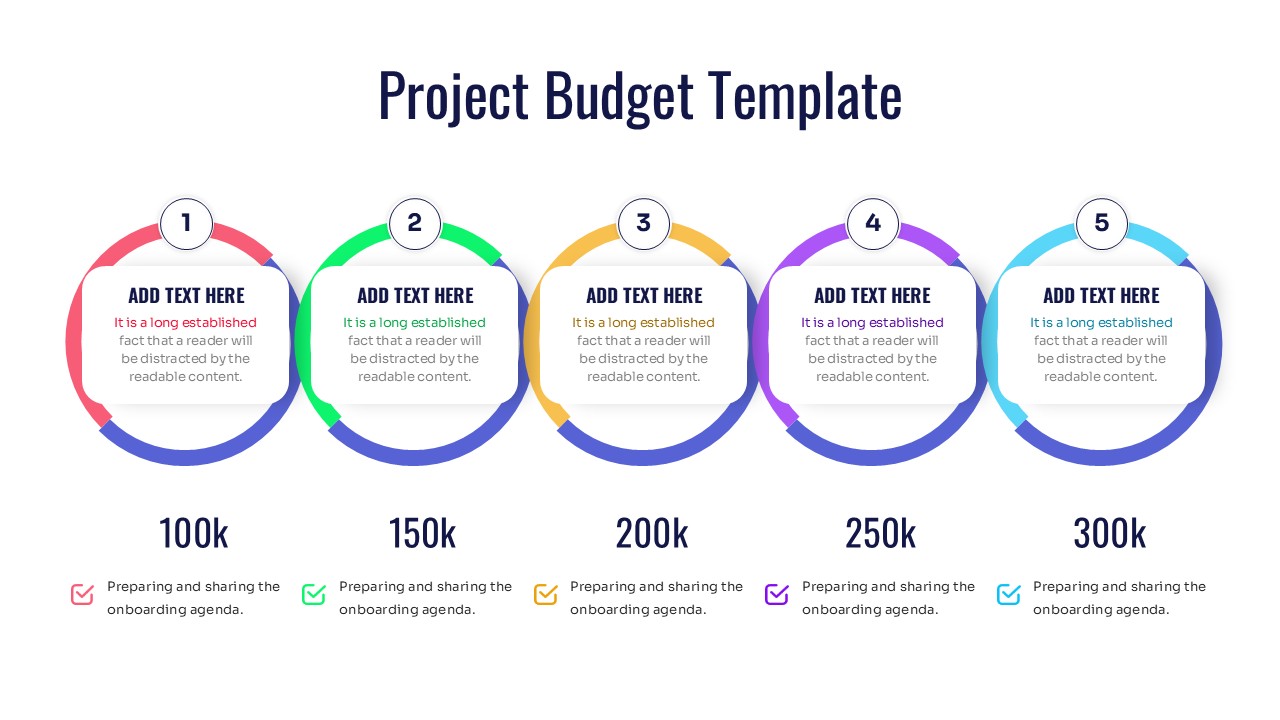
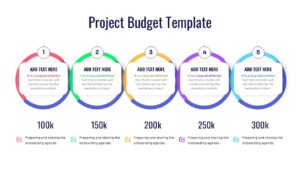
For displaying tiered funding goals, you will find a horizontal sequence of five interconnected circular text boxes sitting above bold budgetary milestones. If your data requires a different visual approach, users can easily pivot to our statistical infographics to compare actuals versus projections. Thus, presenters from every business domain can download and customize these layouts to confidently secure their next round of funding. Try it now!
Key Features
- 100% Vector-Based Graphics
- Fully Layered & Organized
- Multi-Platform Support
- Theme Color & Theme Font
- 16:9 & 4:3 Aspect Ratios
Frequently Asked Questions
- Can I change the currency symbols?
- Yes, all text fields, including currency symbols and values, are fully editable to match your local currency.
- Is the data linked to Excel?
- These slides use PowerPoint\'s native charting and vector shapes, allowing you to update data directly on the slide easily.
- Does it support dark mode?
- Yes, the vector elements can be recolored to fit any background, including dark themes.
Related Templates
-
 Free
Free -
-
 Free
Free -