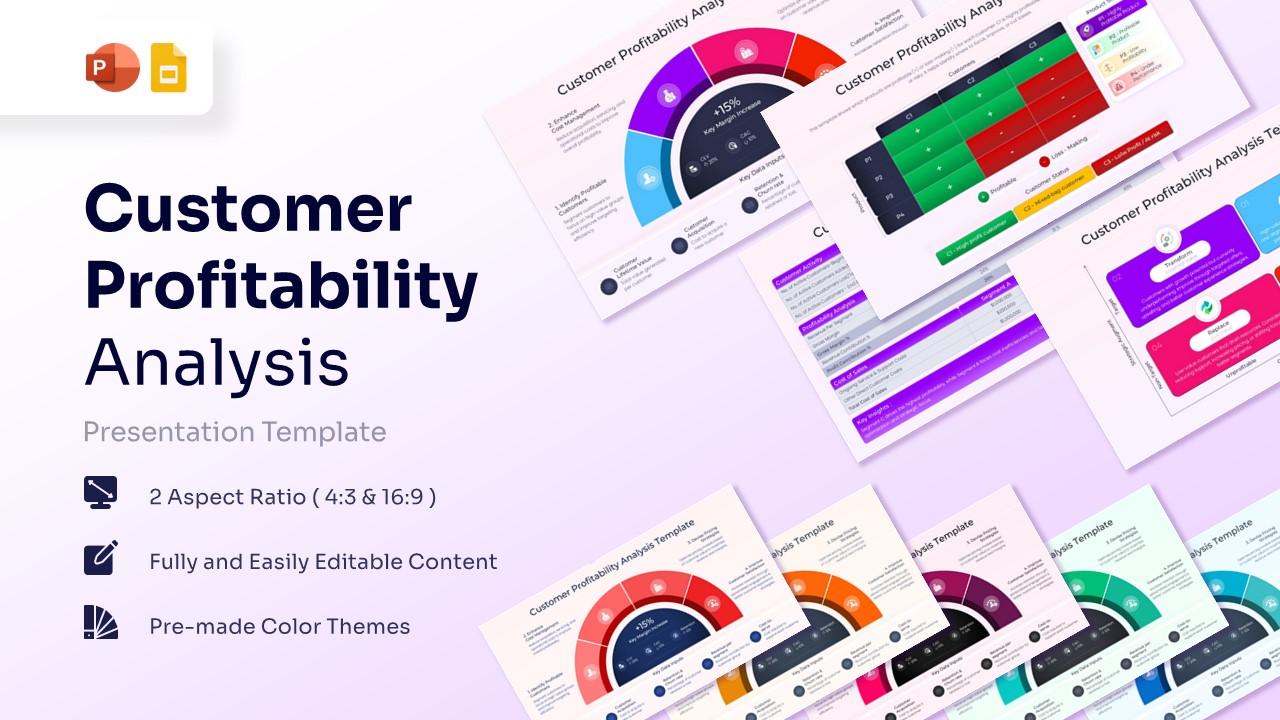
Free Customer Profitability Analysis Template for PowerPoint & Google Slides


Customer Segmentation Dashboard Presentation Template
The Free Customer Profitability Analysis PowerPoint and Google Slides Template helps organizations evaluate customer value, measure profitability, and improve resource allocation. By identifying the most profitable customer segments, businesses can make smarter decisions and develop more effective growth strategies.
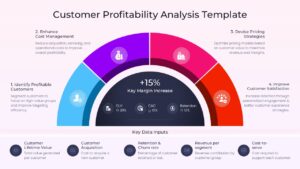
Whether you are analyzing customer lifetime value, measuring acquisition costs, or evaluating retention performance, these slides help transform financial data into actionable insights. As a result, teams can better understand customer behavior, optimize investments, and focus on high-value opportunities.
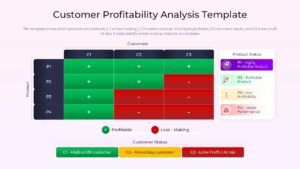
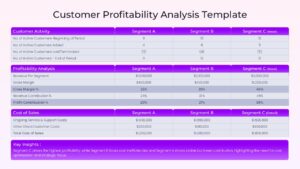
The presentation includes customer profitability matrices, segmentation dashboards, profitability heatmaps, revenue analysis frameworks, cost-to-serve models, and customer value assessments. In addition, the layouts help visualize relationships between customer acquisition costs, revenue contribution, retention rates, and long-term profitability.
Organizations can use these slides to support sales planning, customer success initiatives, financial reviews, and strategic decision-making. Furthermore, the template works well alongside financial analysis templates, dashboard presentation templates, customer journey map templates, and business strategy PowerPoint templates to create more comprehensive business presentations.
Fully editable in PowerPoint and Google Slides, users can customize charts, tables, heatmaps, icons, and financial metrics with ease. Financial analysts, sales leaders, marketing teams, consultants, customer success managers, and business executives can use this template to present customer insights, profitability trends, and growth opportunities in a clear and professional format.
Key Features
- 100% Vector-Based Graphics
- Fully Layered & Organized
- Multi-Platform Support
- Theme Color & Theme Font
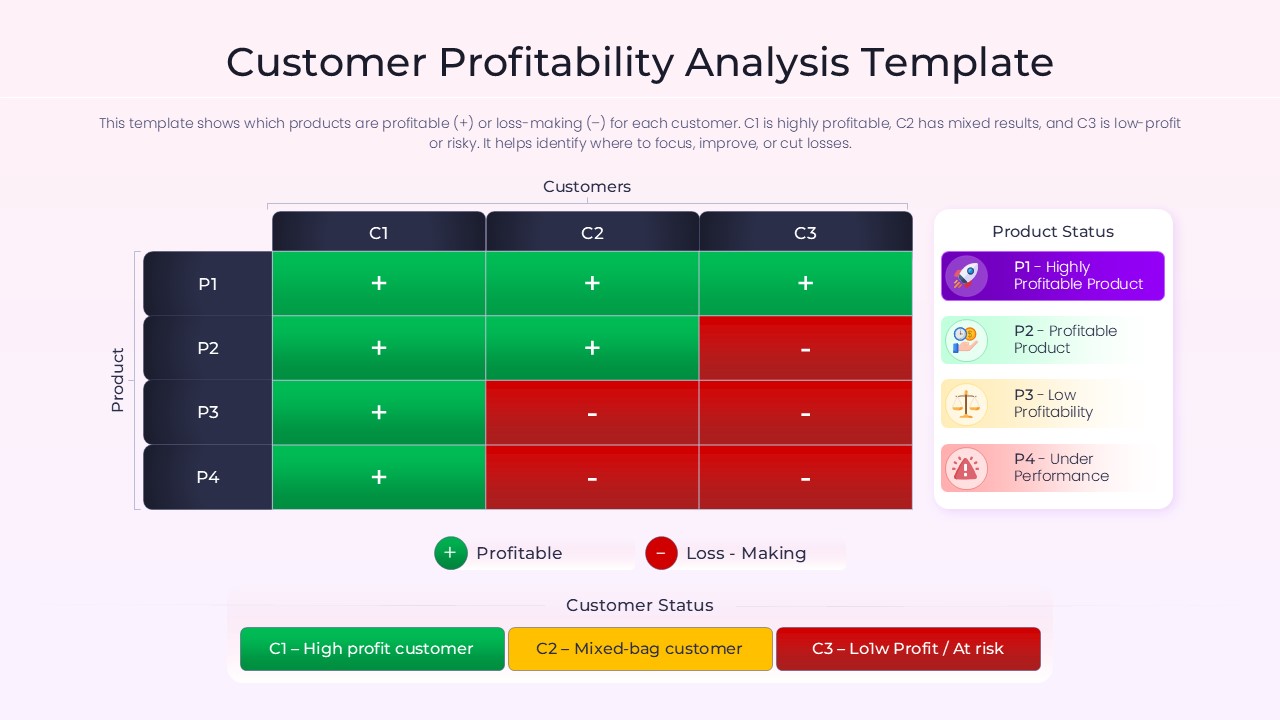
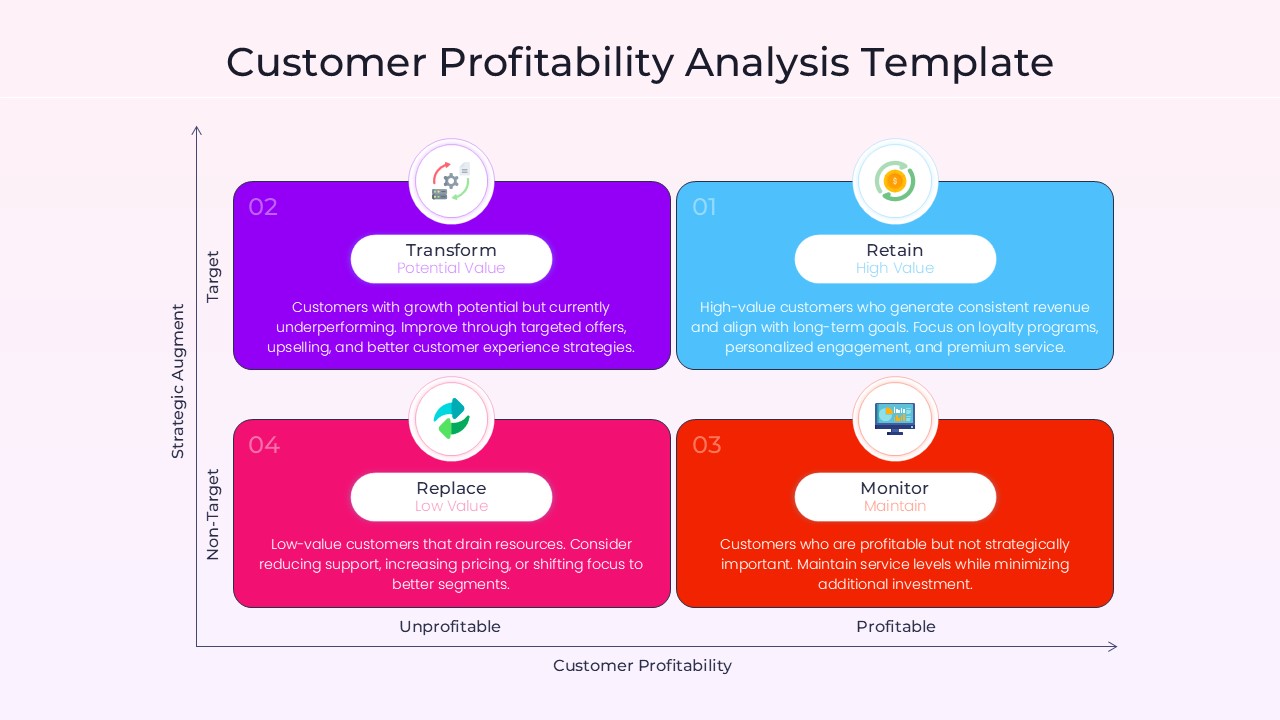
- Editable Customer Profitability Matrix (Target vs. Profitability)
- Pre-populated Data Tables for Gross Margin Analysis
Frequently Asked Questions
- How do I edit the data in the Customer Profitability Analysis tables?
- The tables are fully editable shapes; simply click into the cells to change the numbers and labels to reflect your specific business data.
- Can I change the colors of the Profitability Matrix Slide segments?
- Yes, every section of the matrix and gauge is a vector shape that can be recolored using the standard fill tool in your presentation software.
- Is this Client Lifetime Value Model compatible with Google Slides?
- Absolutely, the file is fully optimized for both PowerPoint and Google Slides to ensure seamless cross-platform functionality.
Related Templates
-
-
 Free
Free -
 Free
Free -
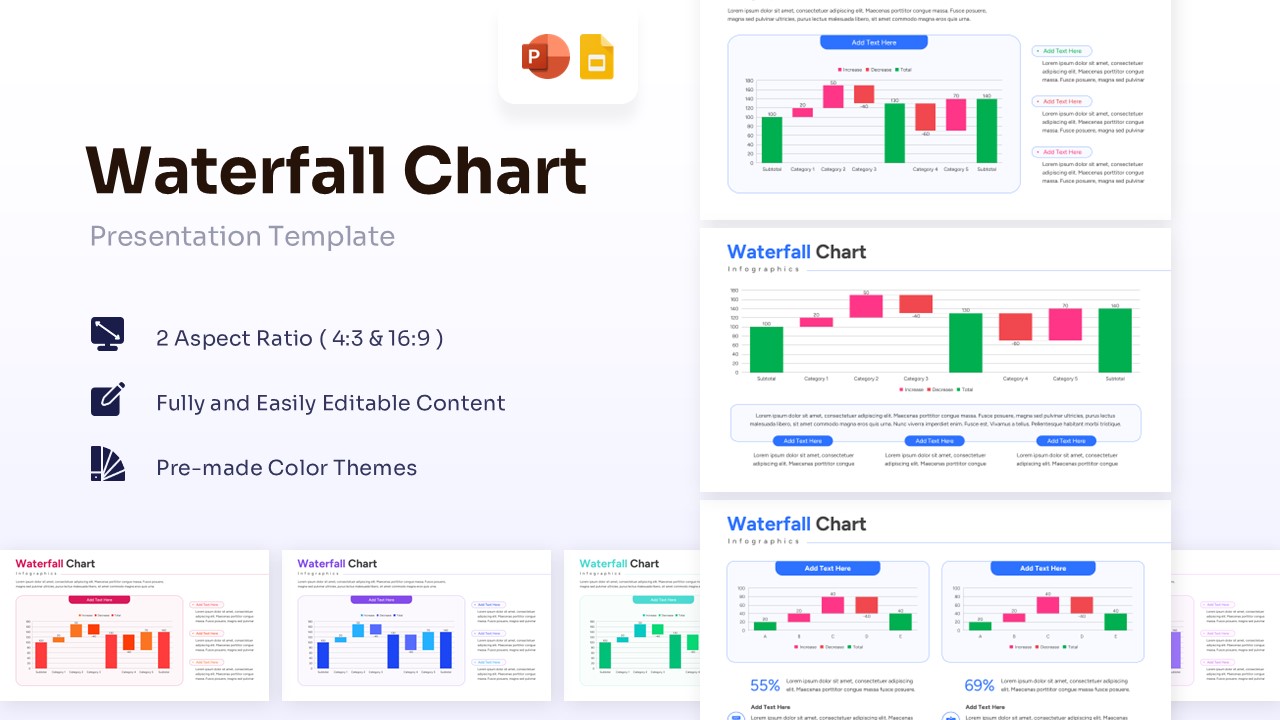
Free Waterfall Chart Template for PowerPoint & Google Slides
Bar and Column
Free