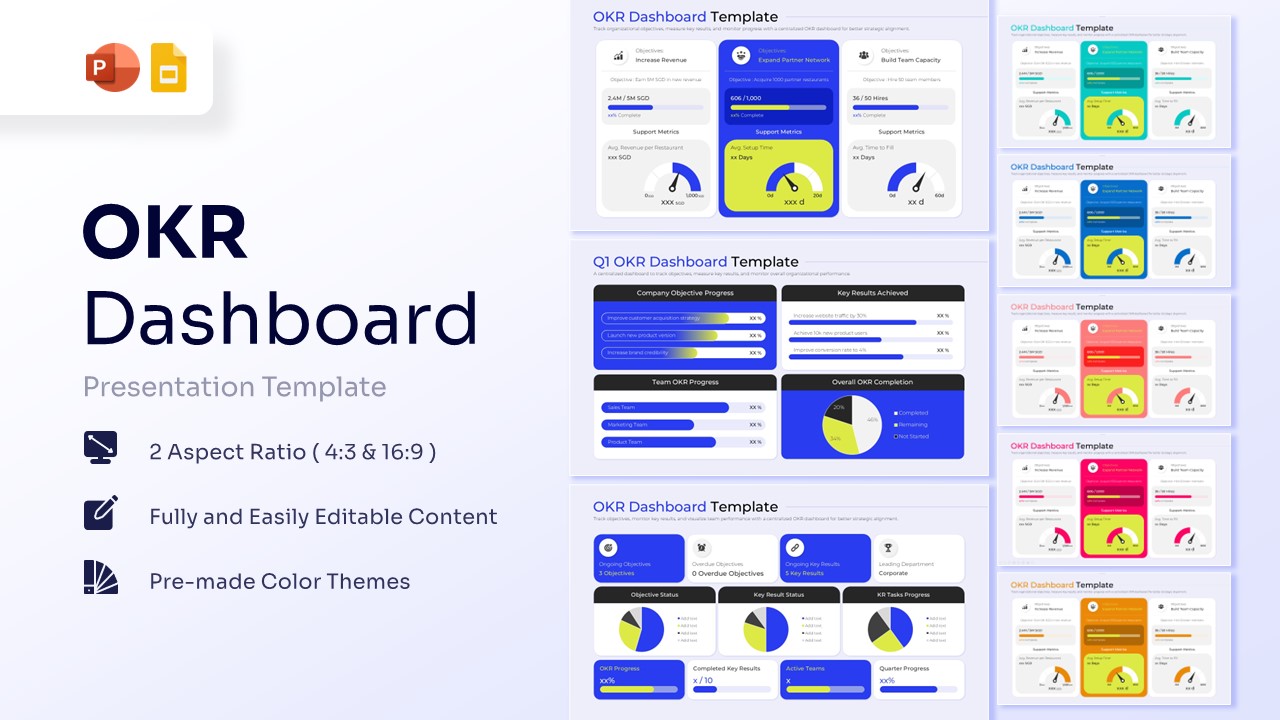
Free Corporate Fact Sheet Template for PowerPoint & Google Slides
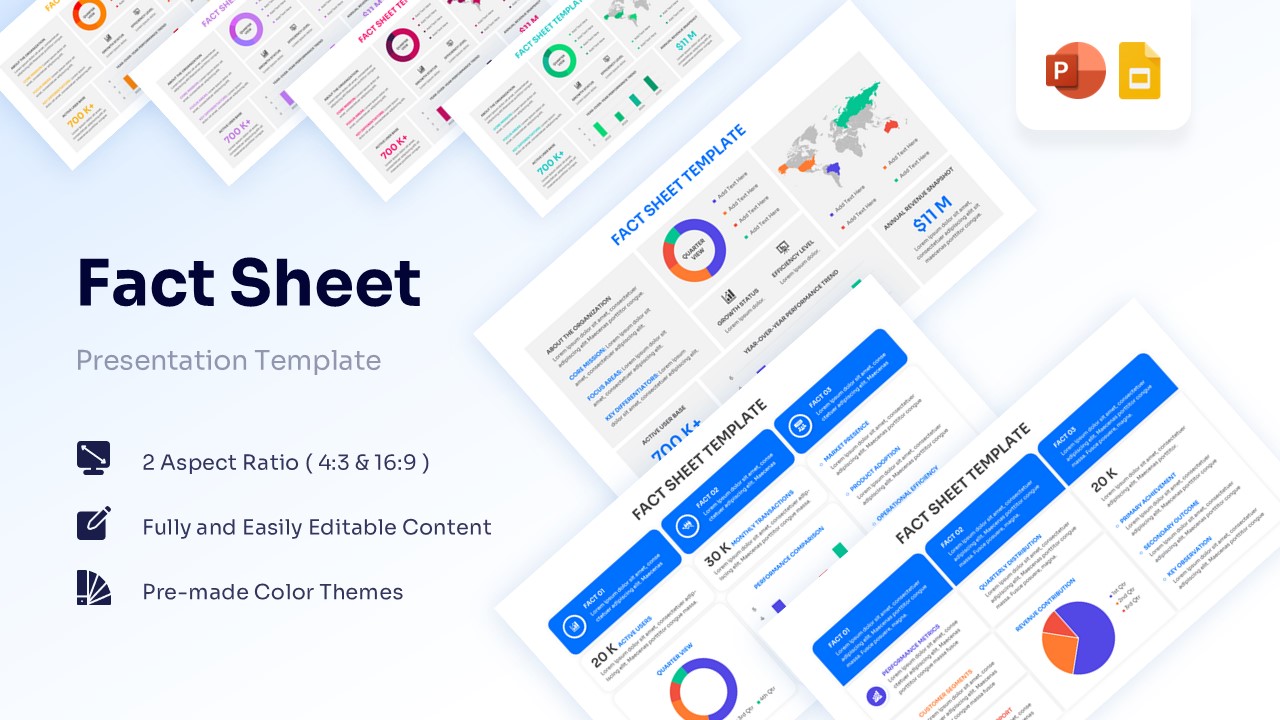


Corporate Fact Sheet PPT for Professional Presentations
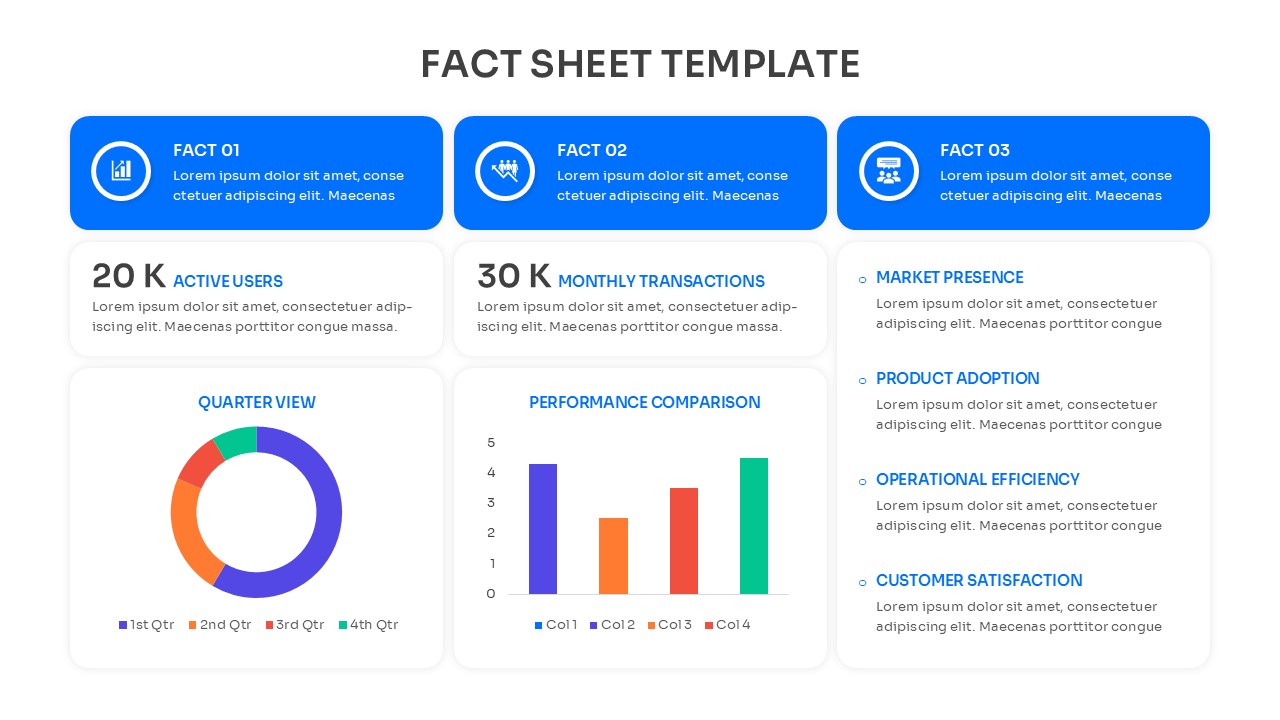
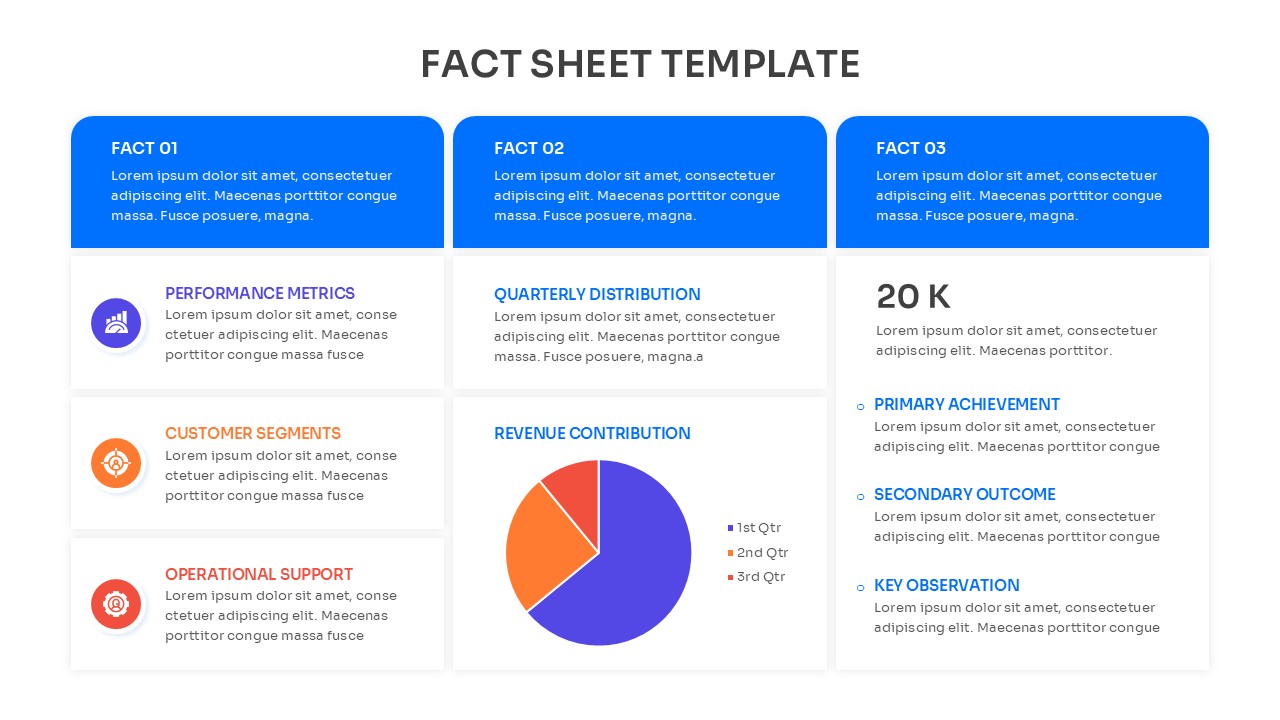
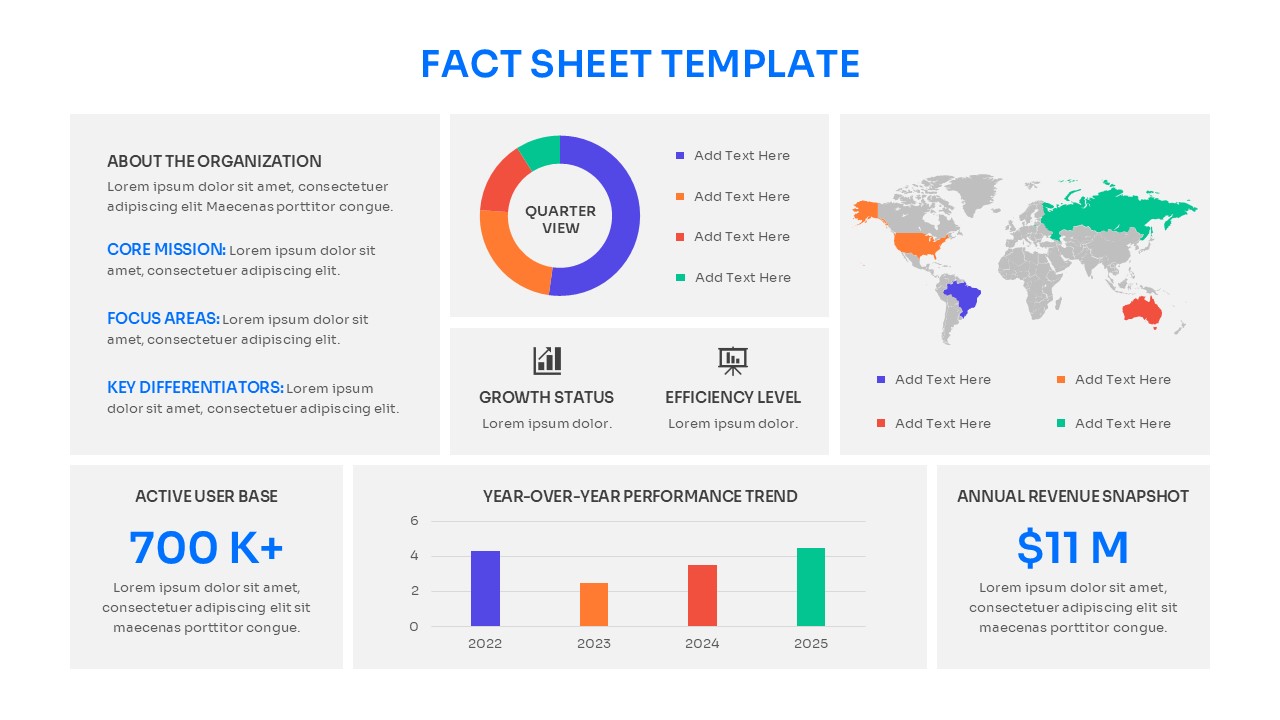
Structures multifaceted data intelligence through high-impact free corporate fact sheet template, featuring clean grid layouts, multi-colored data visualization charts, and concise textual callout containers. Streamlines intricate organizational performance statistics, enabling presenters to deliver high-level briefings without overwhelming stakeholders with dense text. Employs vivid pie and donut charts, clean bar graphs, and bold statistical typography accented by professional blue container blocks to maximize visual scannability. Delivered in a completely editable layout, this tool perfectly suits executive quarterly business reviews, investor reports, or operational performance dashboards highlighting commercial updates. Adapts fluidly to academic contexts or research summaries where educators and students need a clear educational timeline presentation tool to outline structural or historical data components. Concludes by ensuring a highly polished look that integrates seamlessly into corporate decks, stakeholder briefings, and academic data reviews alike.
Key Features
- 100% Vector-Based Graphics
- Fully Layered & Organized
- Multi-Platform Support
- Theme Color & Theme Font
- Two Aspect Ratios (4:3 & 16:9)
Frequently Asked Questions
- How do I edit the charts in this Fact Sheet?
- Simply click on the chart element within PowerPoint or Google Slides to modify the data points; the visuals will update automatically to reflect your new figures.
- Can I change the map to a specific country?
- The template includes a high-level world map; however, the shapes are vector-based, allowing you to highlight specific regions or swap it out for a detailed country map while keeping the style consistent.
- Is this template suitable for a printed handout?
- Yes, the clean design and high-resolution layout make it perfect for both digital presentations and physical printouts for meetings.
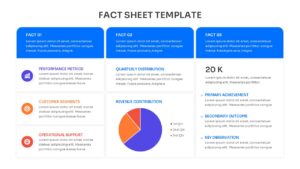
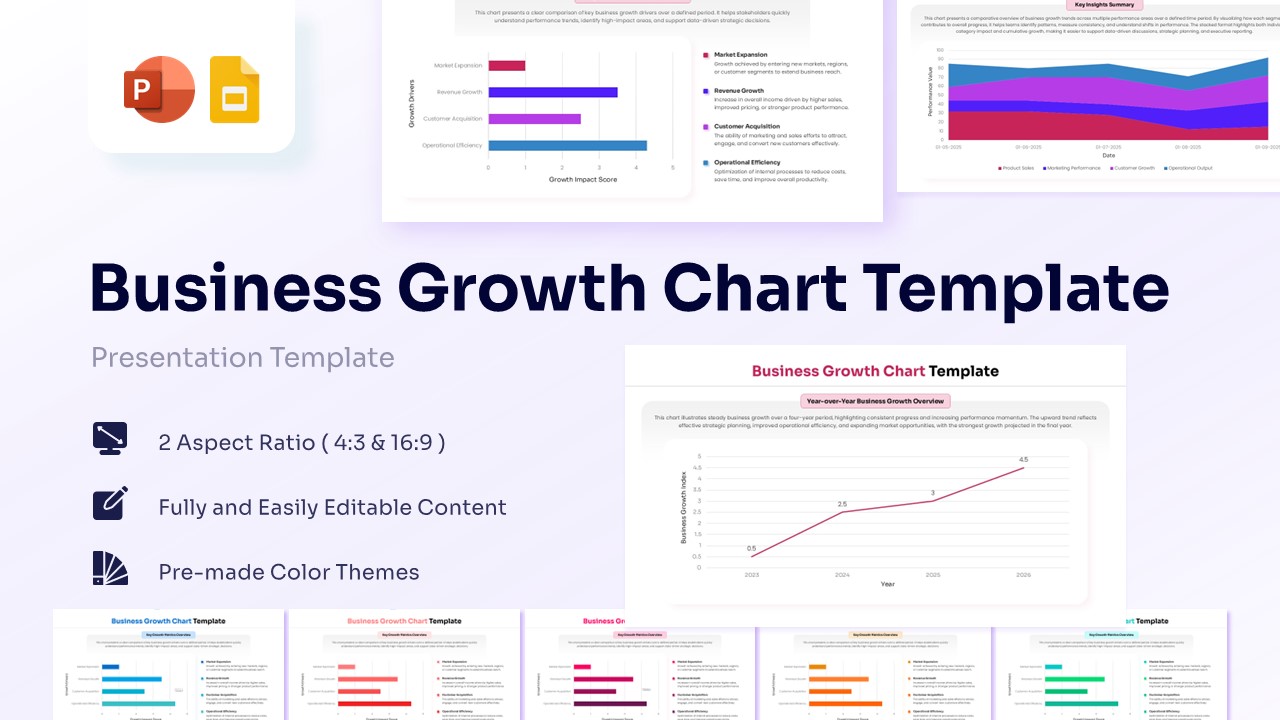
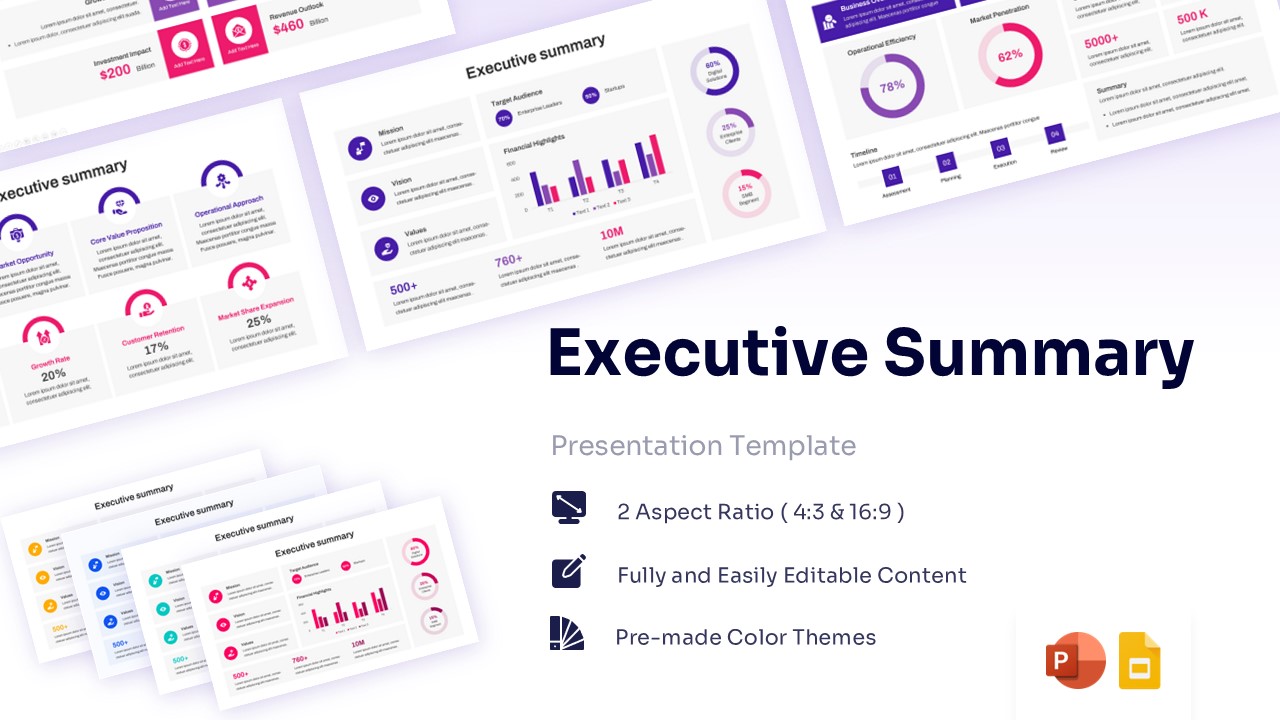
Related Templates
-
 Free
Free -
-
 Free
Free -