Free Blank Column Chart Template for PowerPoint & Google Slides


Editable Column Graph Infographic Template
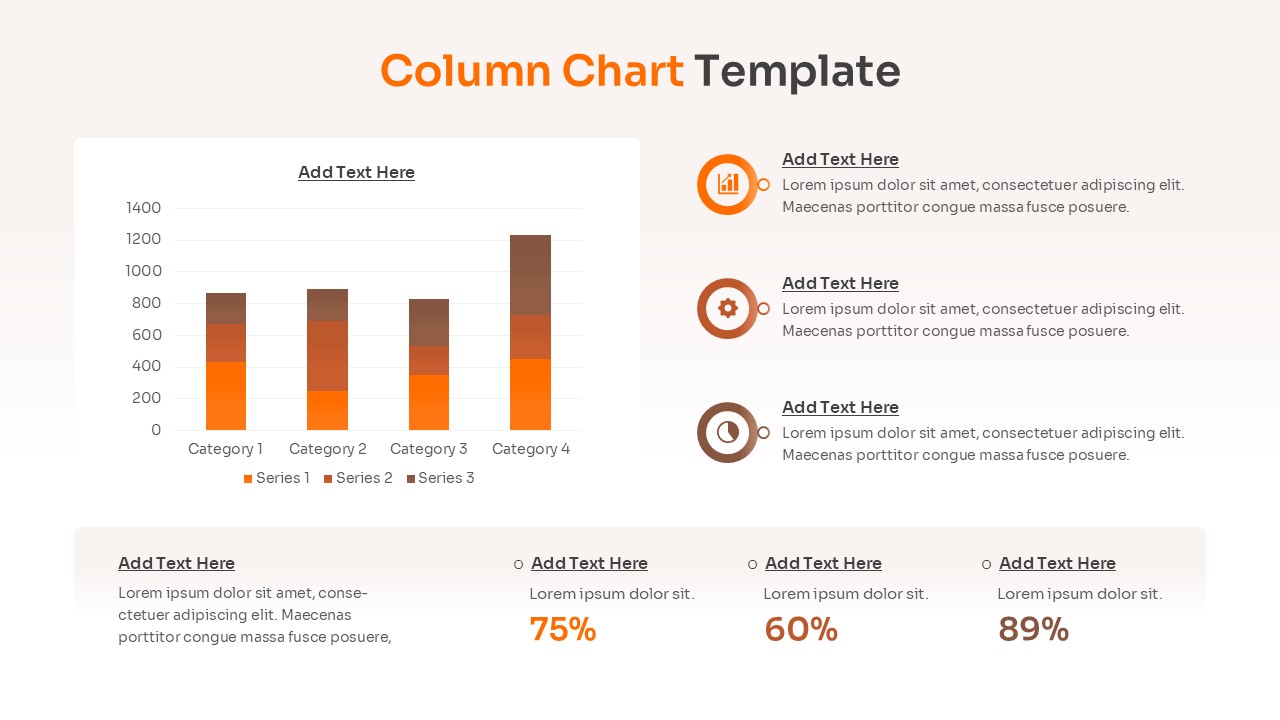
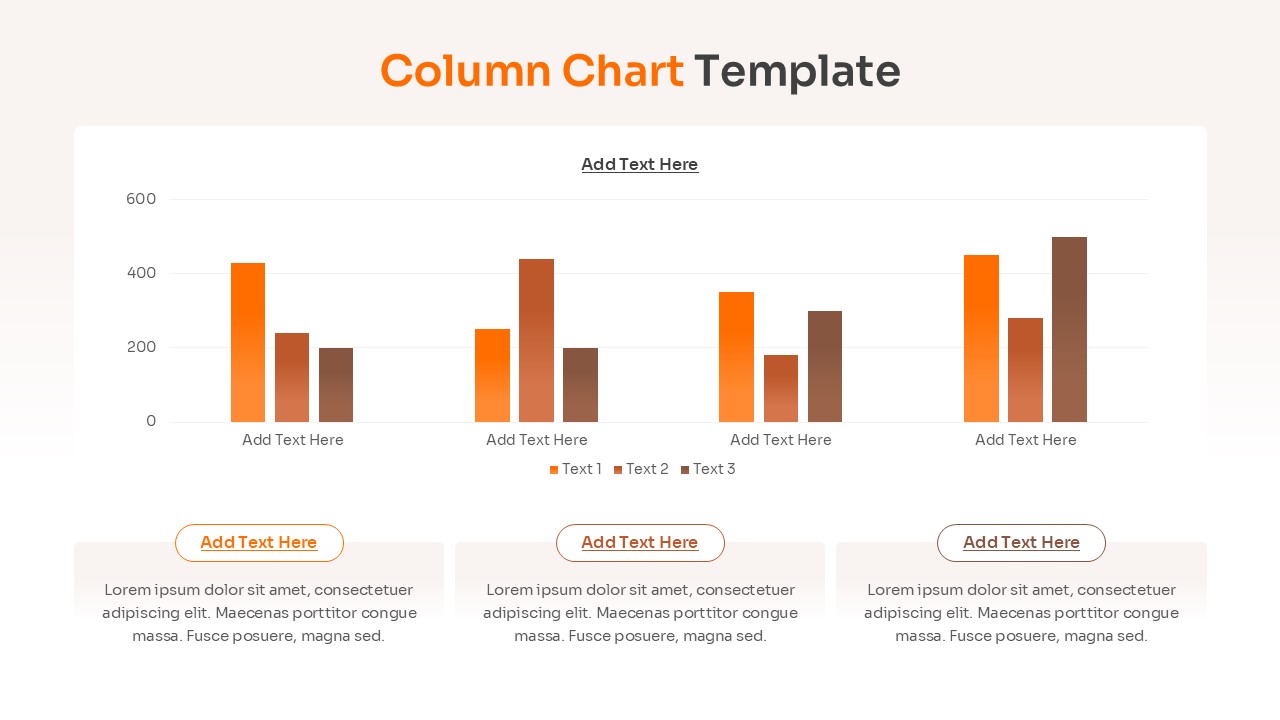
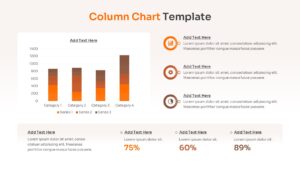
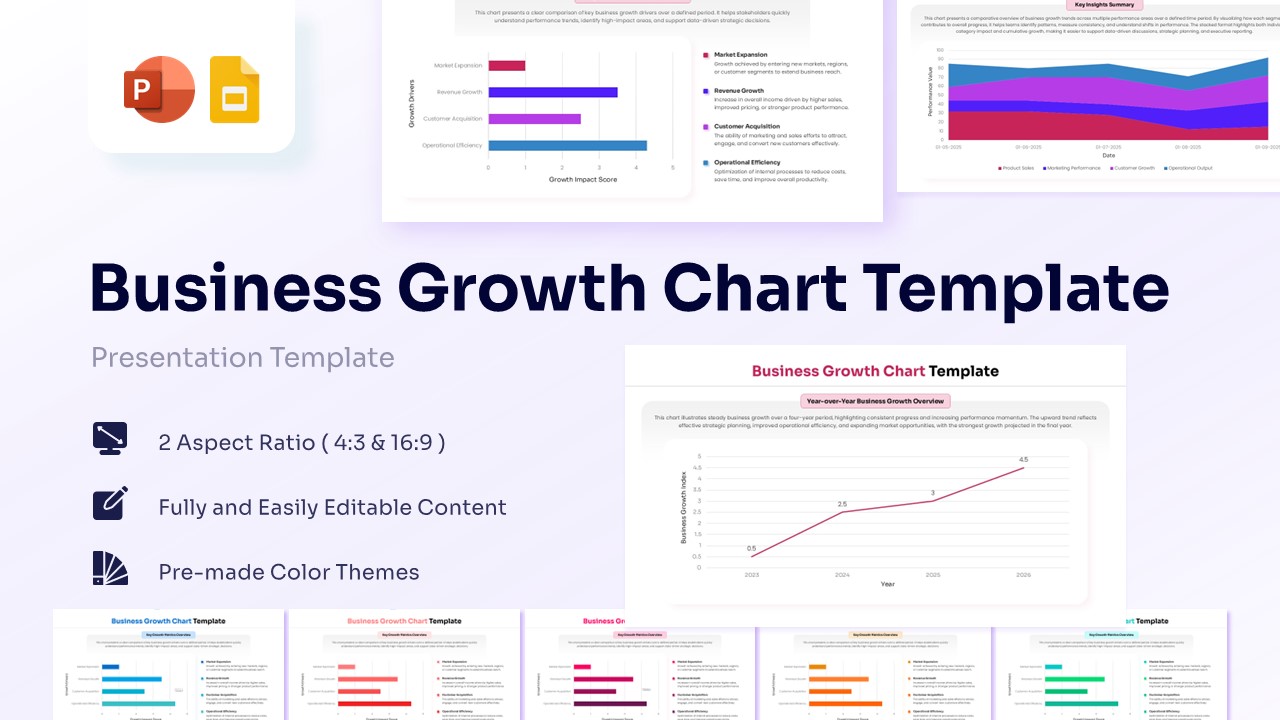
The Free Blank Column Chart Template is a structured presentation design created to illustrate quantitative data using a vertical comparison flow. This bar and column template visually maps numerical statistics, categorical segments, and performance metrics in a connected format. It includes labeled sections for distinct data series. The layout clearly shows how these components move through a structured data evaluation flow to produce clear analytical outcomes.
This column chart infographic fits perfectly for financial reporting, market research, and quarterly performance review. Vertical bars help present system relationships in a clear sequence. This blank column chart keeps technical information organized without overcrowding the layout. This free chart template is fully compatible with PowerPoint and Google Slides for corporate and academic presentations.
Key Features
- 100% Vector-Based Graphics
- Fully Layered & Organized
- Multi-Platform Support
- Theme Color & Theme Font
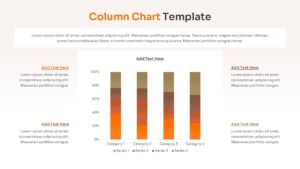
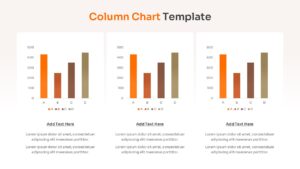
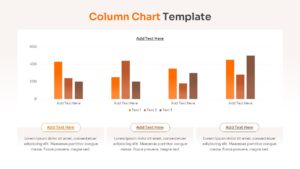
- Includes Grouped and Stacked Chart Variations
- Editable Data Placeholders with Legend Keys
Frequently Asked Questions
- Can I edit the data values directly in these charts?
- Yes, these charts are fully editable within PowerPoint and Google Slides, allowing you to input your specific data points easily.
- Are the colors customizable to fit my brand?
- Absolutely. The template uses theme colors, so you can change the entire color palette with just a few clicks to match your brand identity.
- Does this template support both wide and standard screens?
- Yes, we provide both 16:9 (widescreen) and 4:3 (standard) aspect ratios to ensure compatibility with any projector or monitor.
Related Templates
-
 Free
Free -

-

Free QBR Template for PowerPoint & Google Slides
Annual Report
Free -