Free Thermometer Infographic Template for PowerPoint & Google Slides


Visualize Milestones Using a Temperature Gauge Presentation
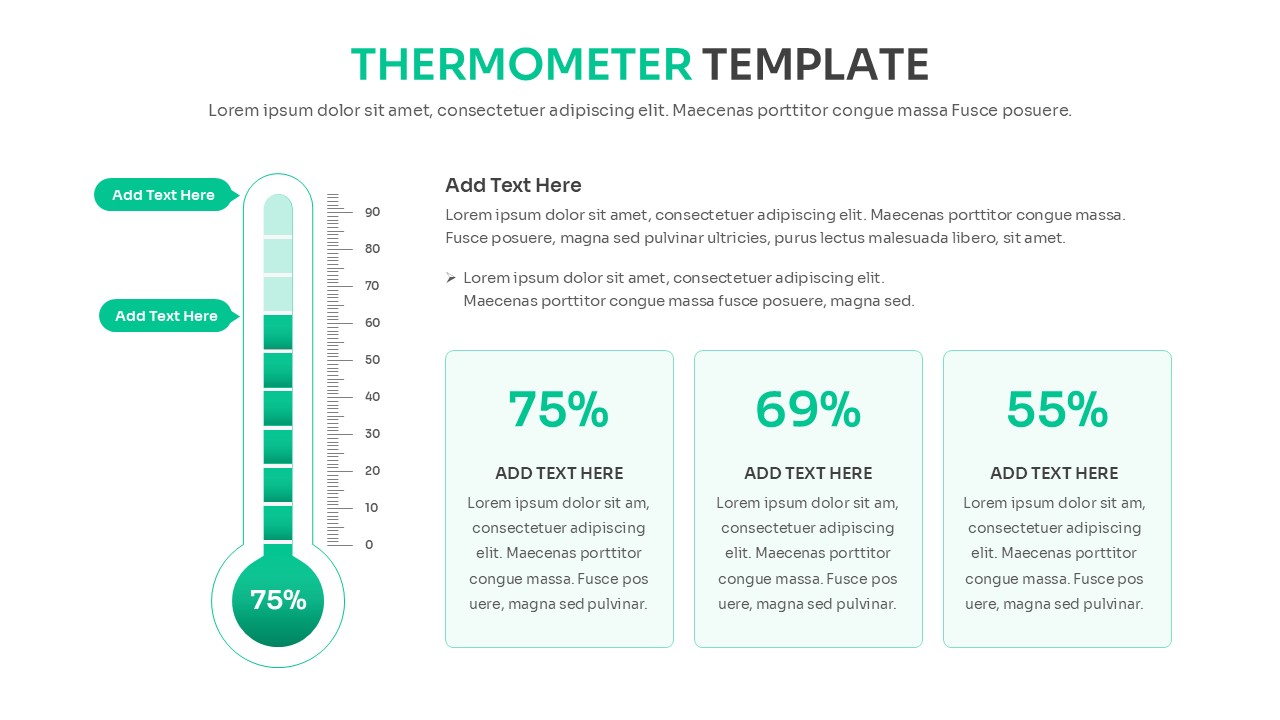
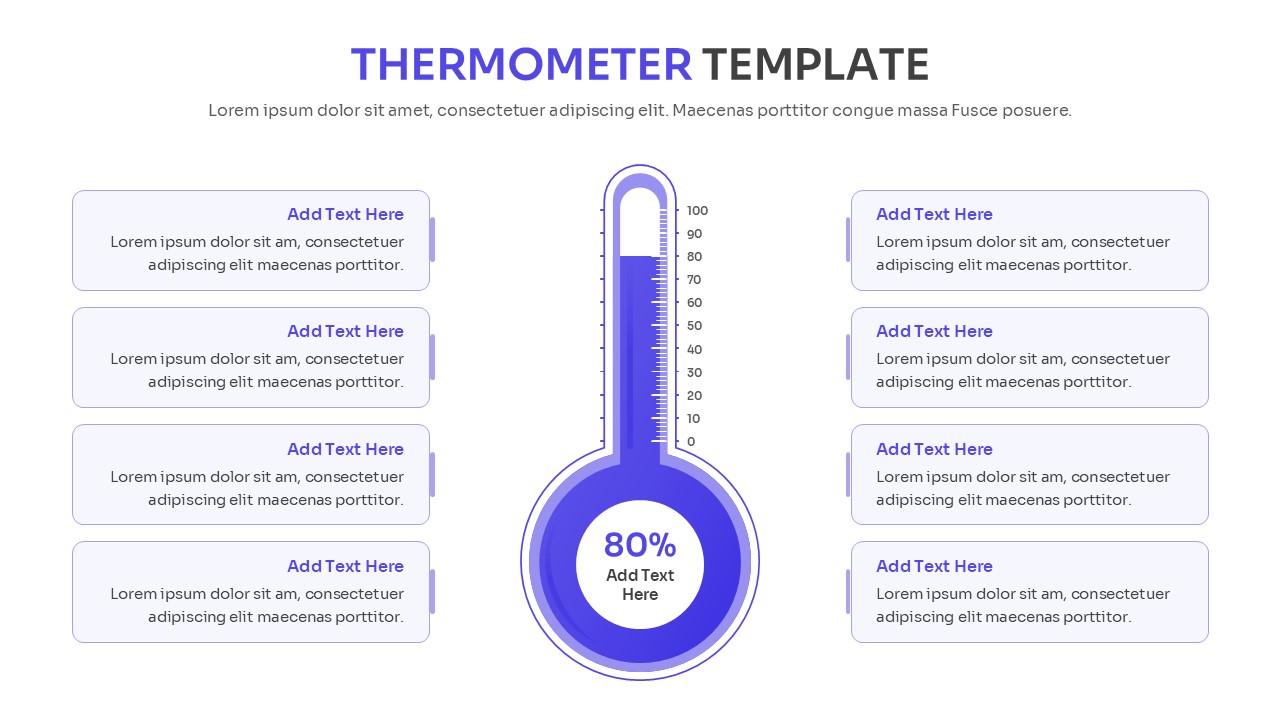
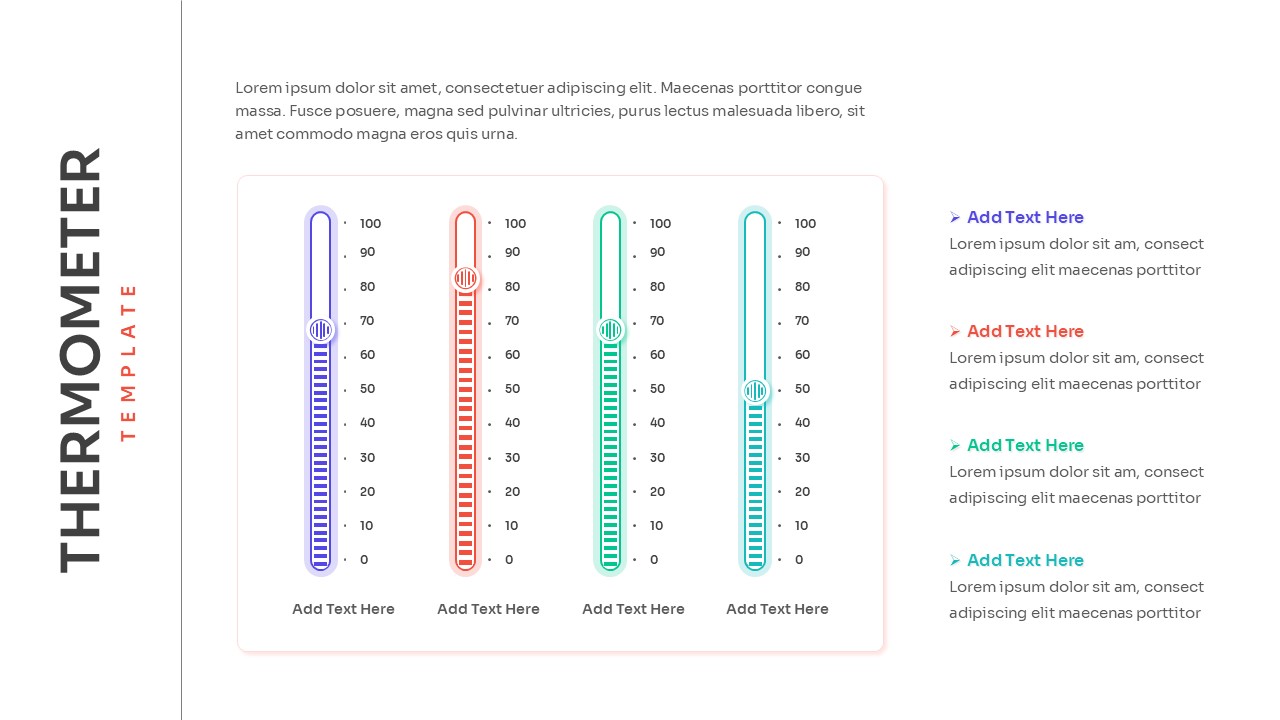
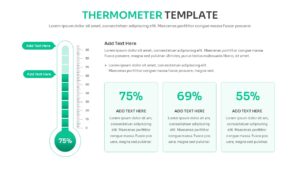
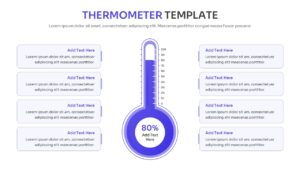
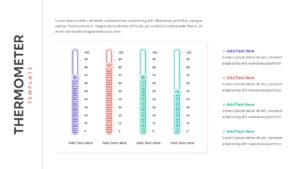
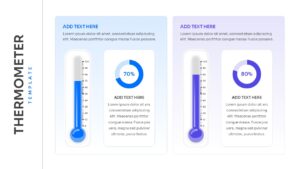
Download this Free Thermometer Infographic Template for PowerPoint or Google Slides and discover the impact of crystal-clear data tracking. This visually striking statistical infographic gives you the power to transform dry statistics into an engaging narrative, ensuring your team instantly grasps key metrics and performance indicators. This PresentoVerse layouts are designed for absolute ease, allowing you to integrate a professional goal tracking graphic seamlessly into your corporate decks. Simply download this thermometer infographic template, choose the specific gauge style that fits your narrative, adjust the brand colors, and paste it directly into your workflow. Move towards clarity and make your next milestone report unforgettable with these dynamic visual assets!
Key Features
- 100% Vector-Based Graphics
- Fully Layered & Organized
- Multi-Platform Support
- Theme Color & Theme Font
Frequently Asked Questions
- Can I change the color of the thermometer fluid?
- Yes, every element is a vector shape, allowing you to change colors to match your brand in just a few clicks.
- Are the percentage values editable?
- Absolutely. You can modify all text boxes and percentage labels to reflect your actual data.
- Does this work with Keynote?
- While optimized for PowerPoint and Google Slides, these files can be imported into Keynote with minimal formatting adjustments.
Related Templates
-
 Free
Free -
 Free
Free -
 Free
Free -
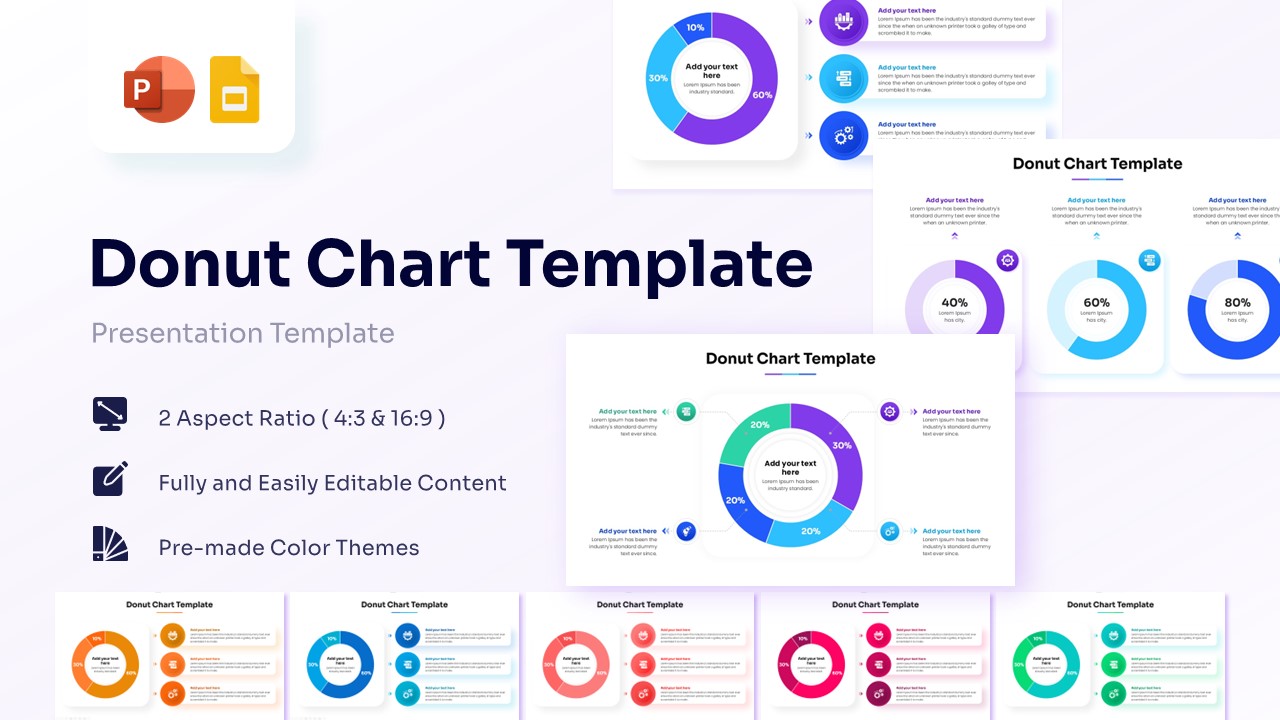
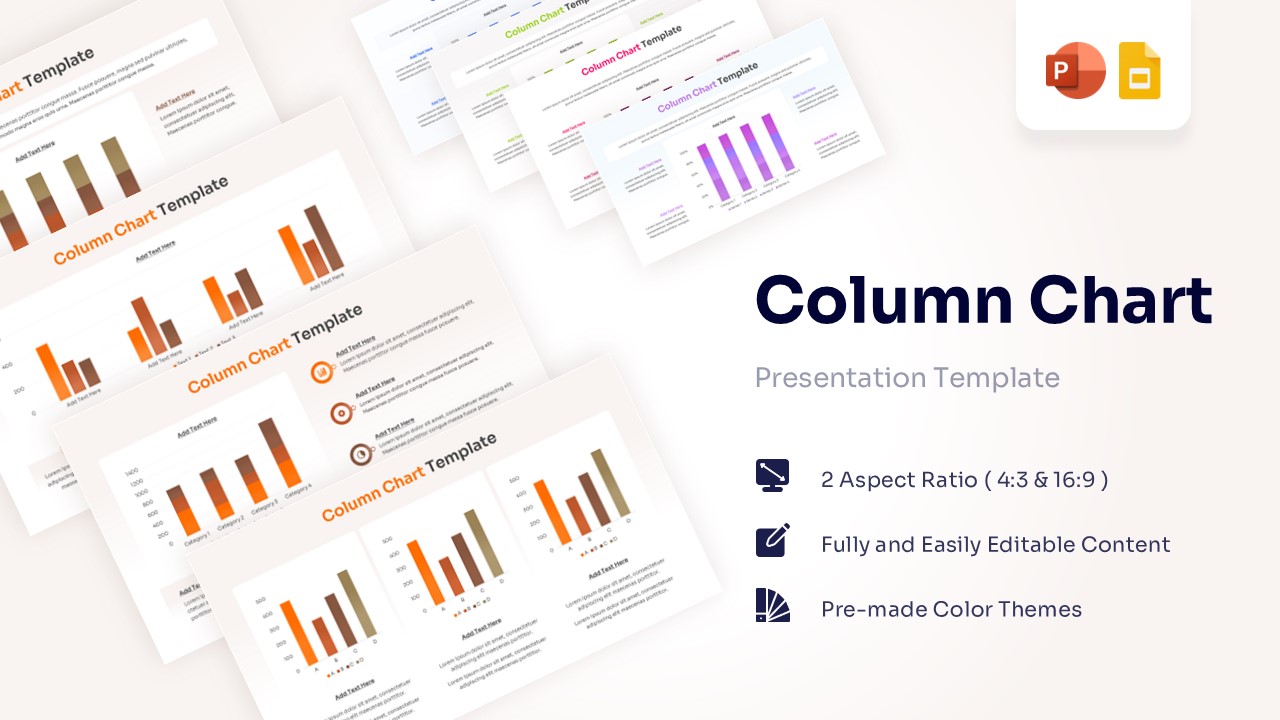
Free Donut Chart Template for PowerPoint & Google Slides
Charts & Graphs
Free