Free Root Cause Analysis Fishbone Diagram Template for PowerPoint & Google Slides


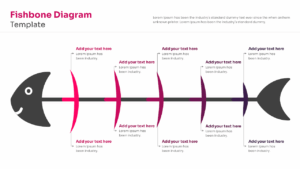
Ishikawa Cause and Effect Presentation Template
Template Details: This PresentoVerse Fishbone Diagram Template is available to download and use. Moreover, it can be seamlessly edited on Microsoft PowerPoint and Google Slides. Explore our cause and effect infographics for deeper analysis options.
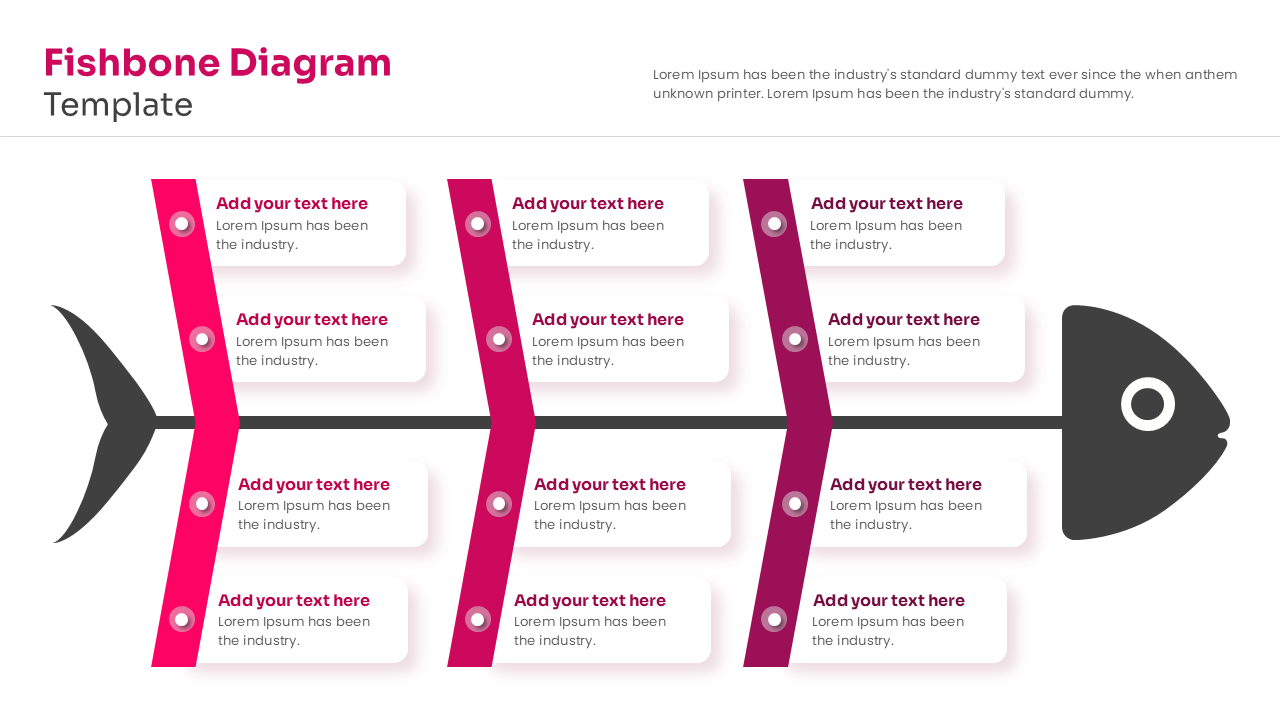
Design Strategy: This Root Cause Analysis diagram is easy map complex cause-and-effect relationships efficiently. Users can present root causes, contributing factors, and problem-solving metrics using this structured fish-shaped outline.
Visual Elements: The template utilizes a flat-vector graphic style with a customizable magenta and purple color palette. It features clean sans-serif fonts, basic shape icons, and a minimal fish silhouette graphic.
Recommended Usage: Business analysts and project managers can track root cause analyses across corporate operations. Discover more via our problem solving diagram collections.
Key Features
- 100% Vector-Based Graphics
- Fully Layered & Organized
- Multi-Platform Support
- Theme Color & Theme Font
- Customizable Fishbone Layouts
- Multiple Node Variations
Frequently Asked Questions
- What is a Fishbone Diagram used for?
- It is a visual tool used for categorizing the potential causes of a problem to identify its root causes.
- Can I change the colors of the fish spines?
- Yes, all elements in this template are fully editable, so you can match them to your company branding.
- Is this template compatible with Google Slides?
- Absolutely, this template is designed to work seamlessly in both PowerPoint and Google Slides.
Related Templates
-
-
-
 Free
Free -
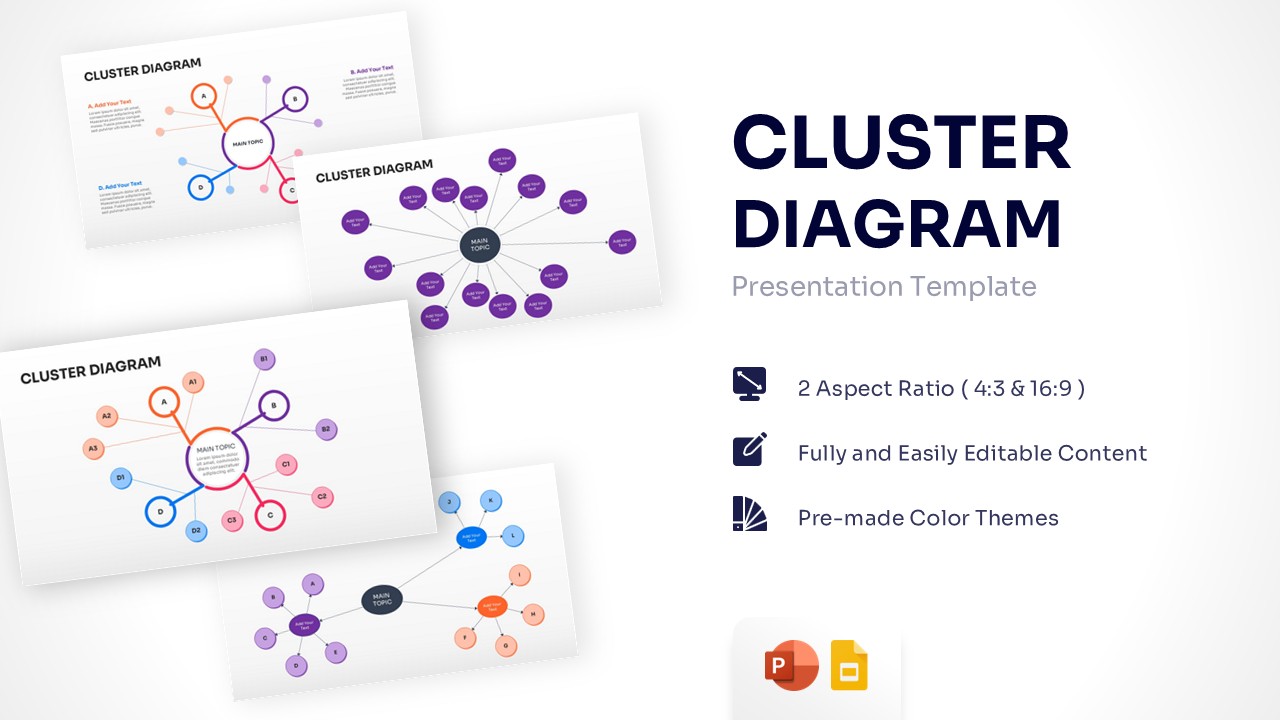
Free Cluster Diagram Template for PowerPoint & Google Slides
Free Templates
Free