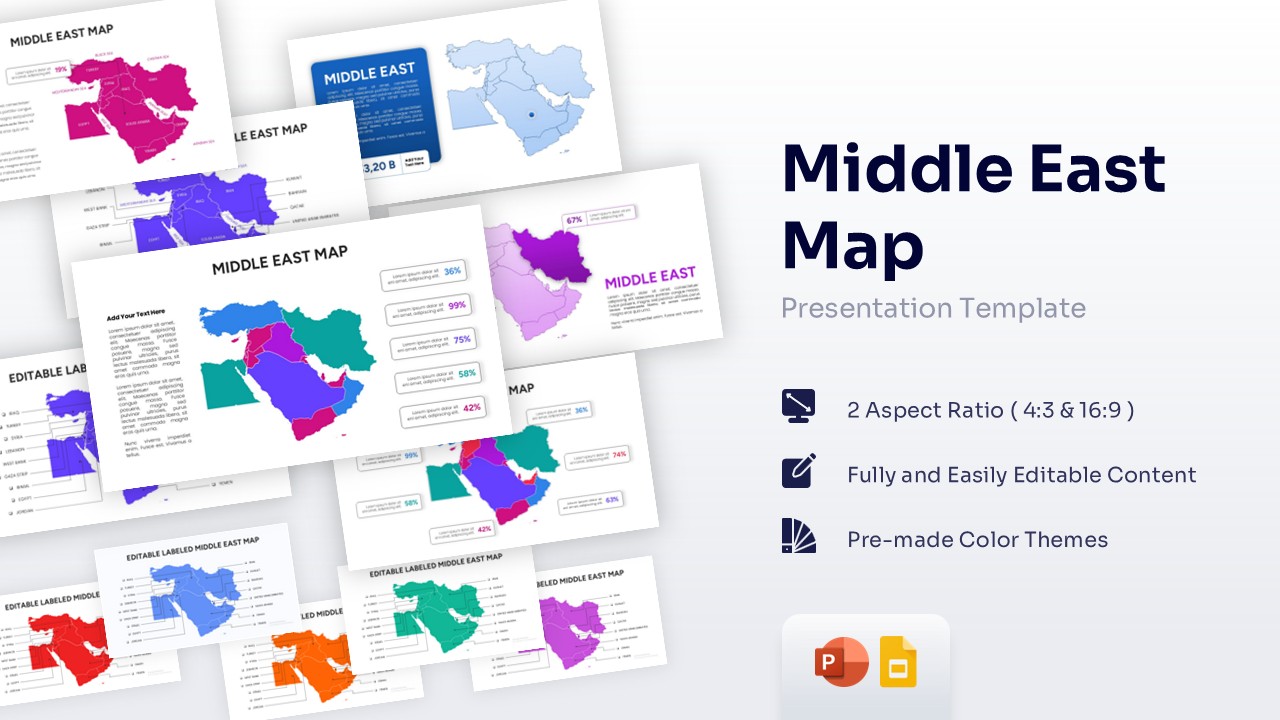
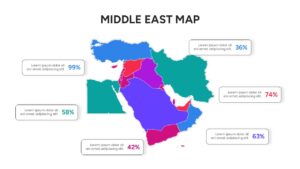
Free Middle East Map Presentation Template for PowerPoint & Google Slides


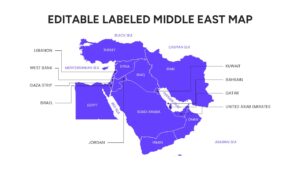

Editable Middle East Countries Map for Regional Analysis
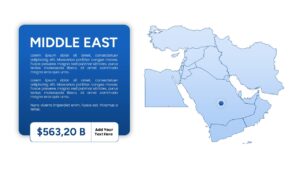
The Free Middle East Map PowerPoint Template provides a simple and professional way to present geographic information, regional insights, and country-level data. These editable map templates help users visualize locations, compare countries, and communicate regional trends with clarity.
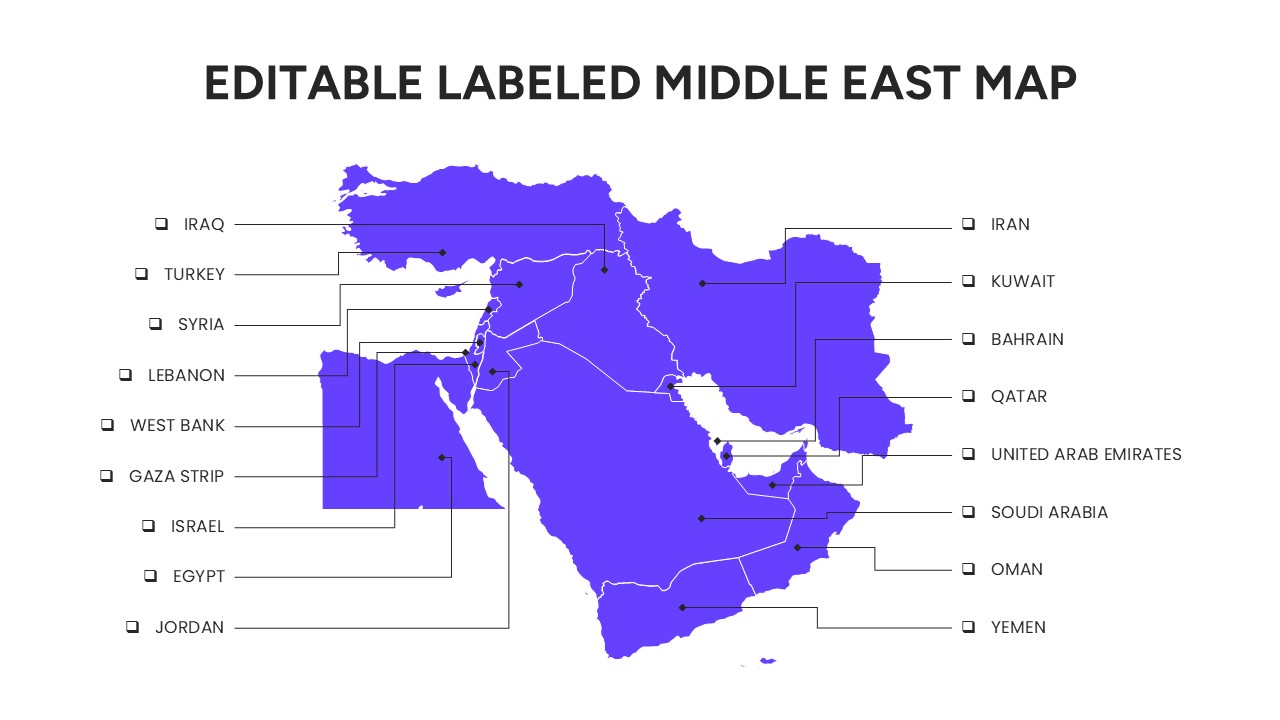
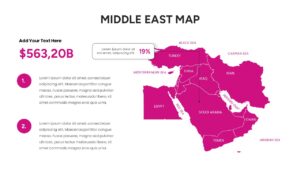
The presentation includes multiple Middle East map layouts with customizable countries, labels, color-coded regions, and infographic elements. Users can easily modify colors, text, icons, and data markers to create presentations for business reporting, market analysis, education, and research.
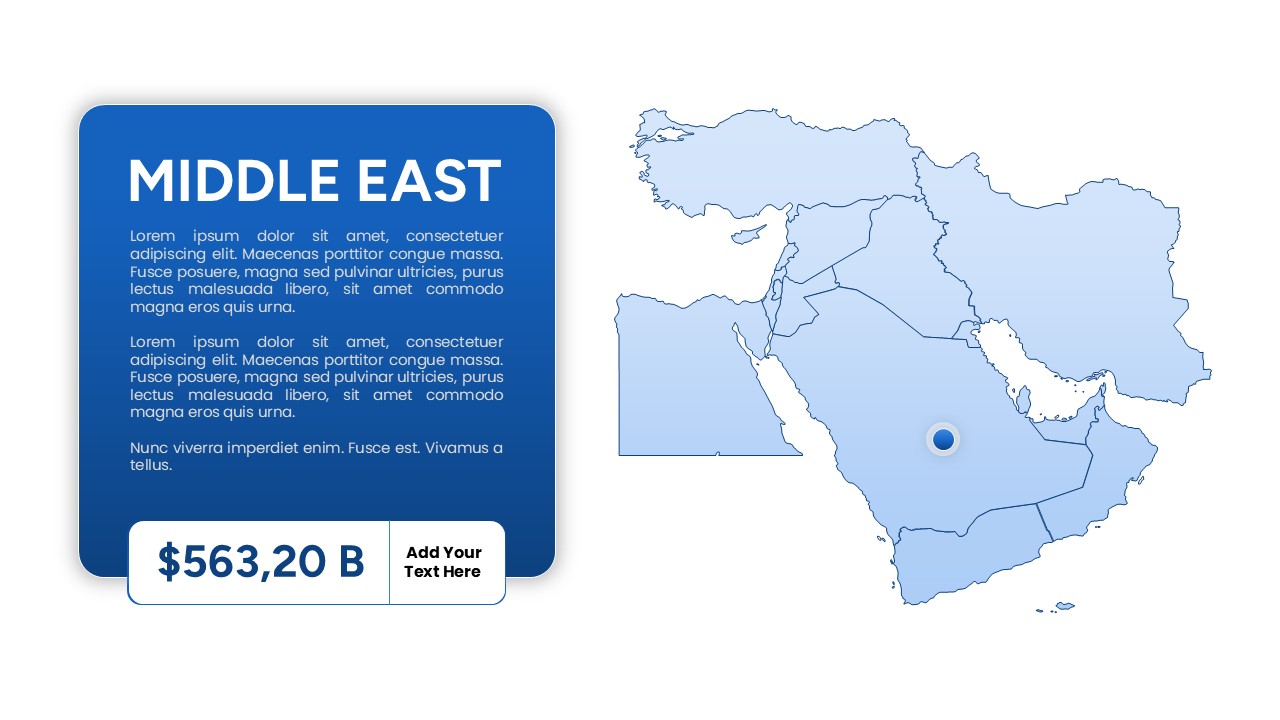
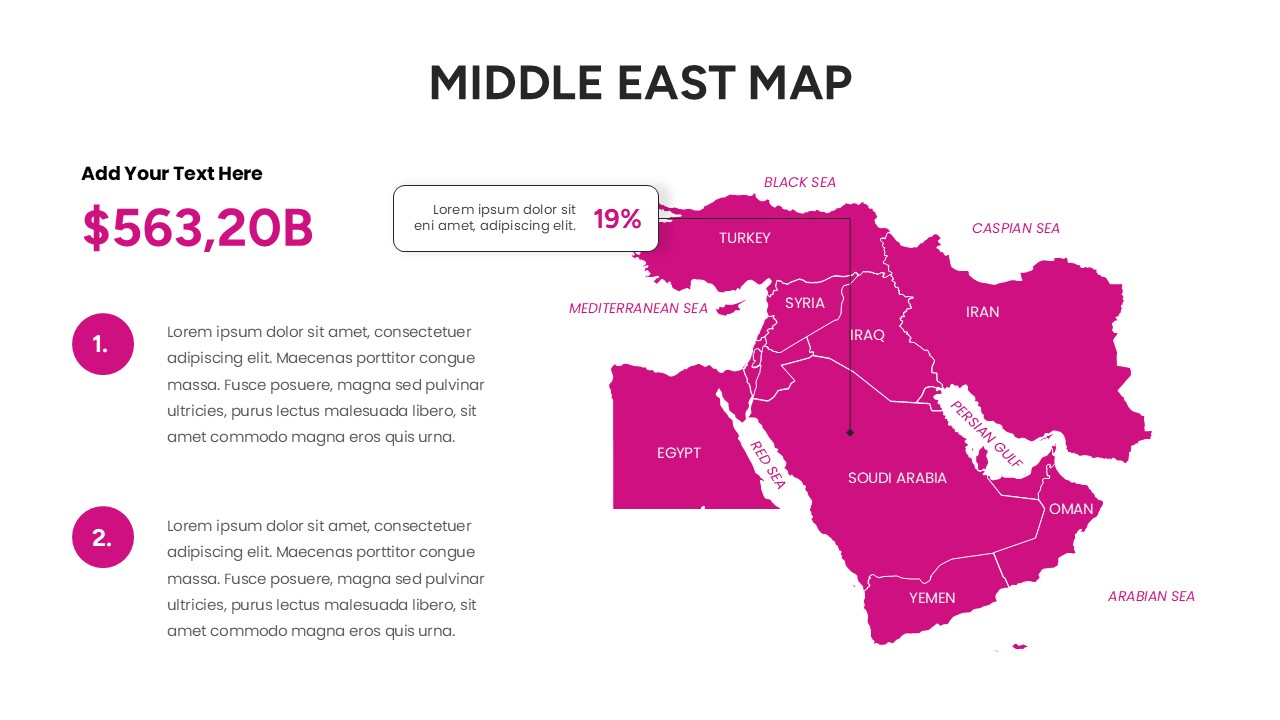
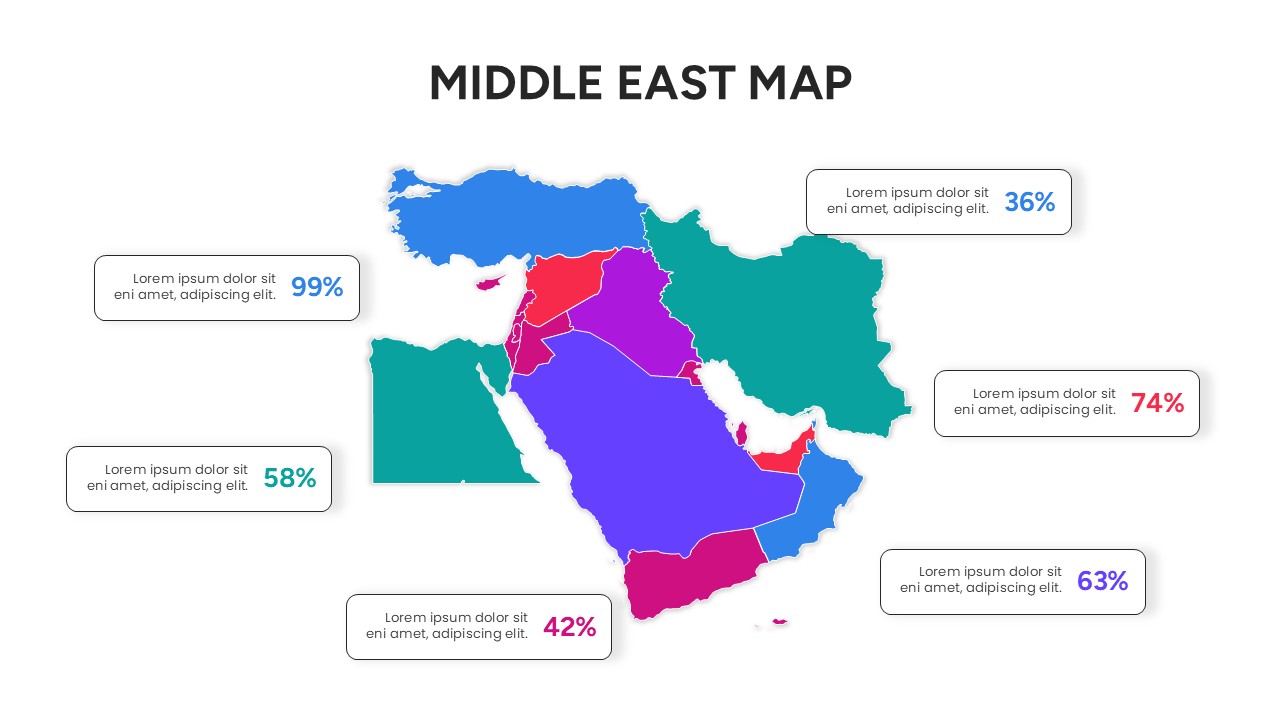
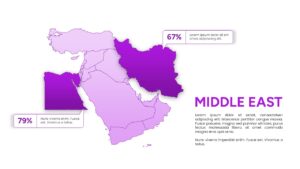
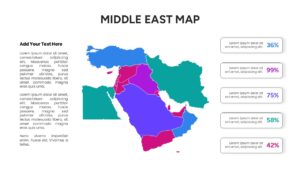
These editable country map infographic templates are ideal for showcasing economic trends, market expansion plans, tourism statistics, trade routes, demographic data, and regional performance metrics. The visual layouts make complex geographic information easier to understand and present.
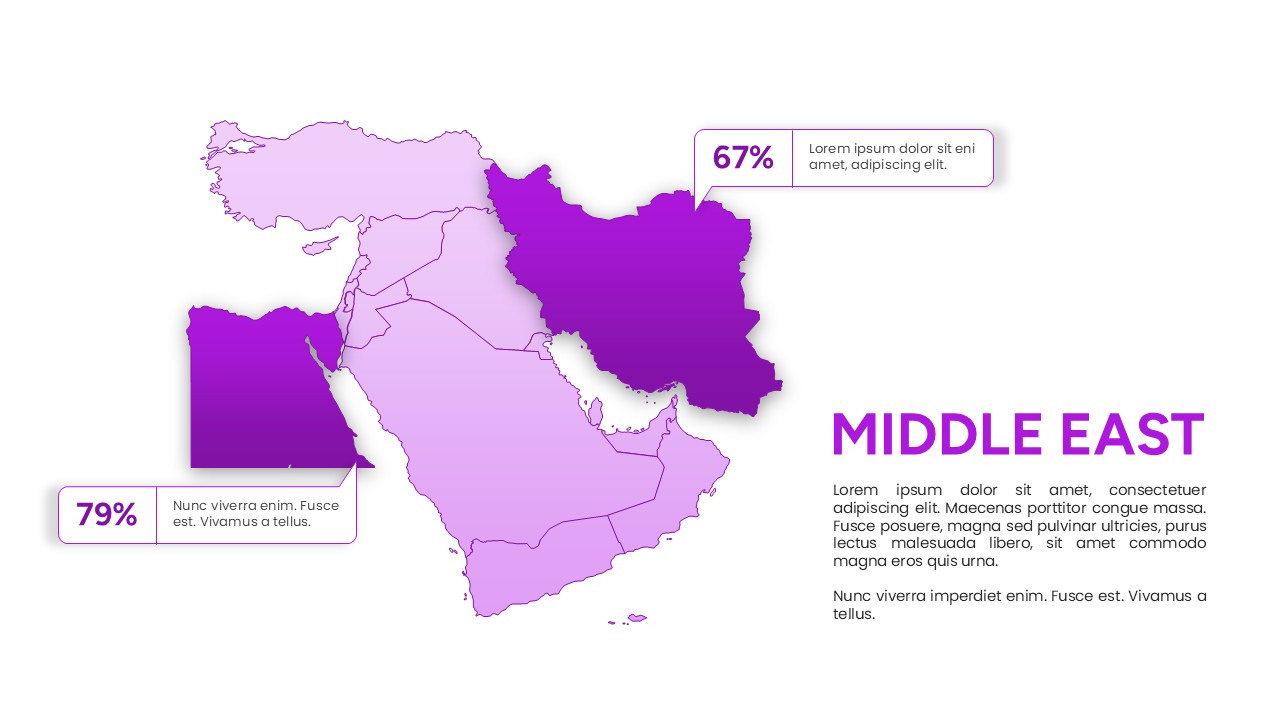
The slides are ideal for presenting economic trends, market expansion strategies, tourism insights, trade routes, population statistics, and regional performance metrics through fully editable PowerPoint objects, allowing users to customize countries, colors, labels, icons, percentages, and data markers without affecting map accuracy. Available in multiple color themes and optimized for both PowerPoint and Google Slides, these layouts provide a professional framework for visual storytelling and geographic reporting.
Looking for more designs? Check out our Free Infographics Template Library for additional options.
Key Features
- 100% Vector-Based Graphics
- Fully Layered & Organized
- Multi-Platform Support
- Theme Color & Theme Font
- Easily editable country borders and labels
Frequently Asked Questions
- Can I change the color of a specific country in the Middle East map?
- Yes, every country is a separate vector shape. You can click on any individual nation and change its fill color using the standard formatting tools in PowerPoint or Google Slides.
- Is this map geographically accurate for professional reports?
- The map is designed as a high-quality infographic for visual representation. While it accurately portrays the relative positions and borders of countries in the Middle East, it is intended for presentation purposes rather than technical cartography.
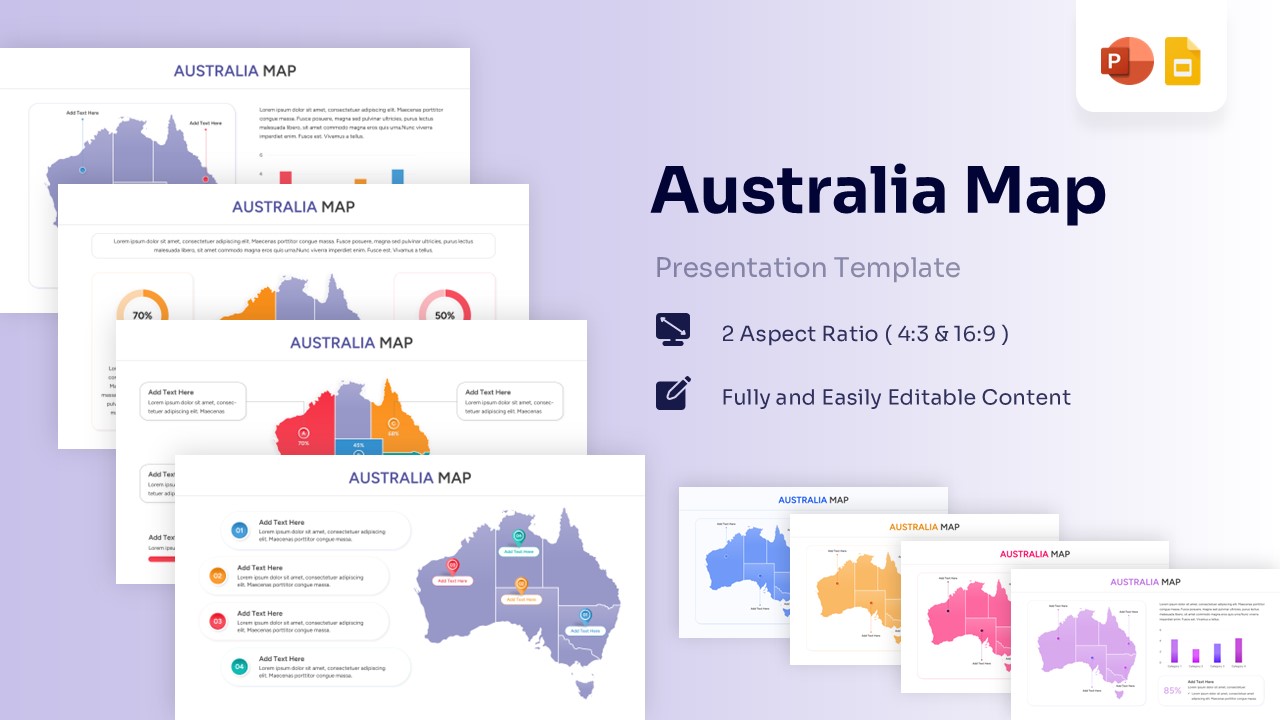
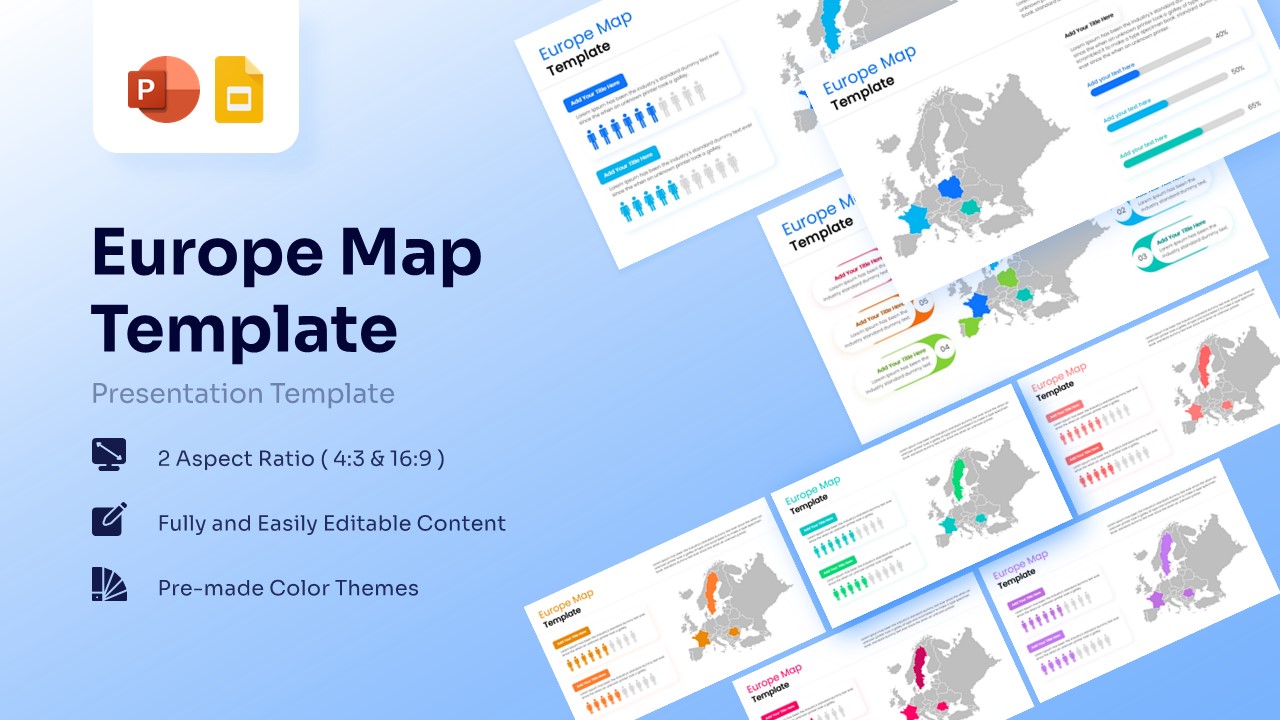
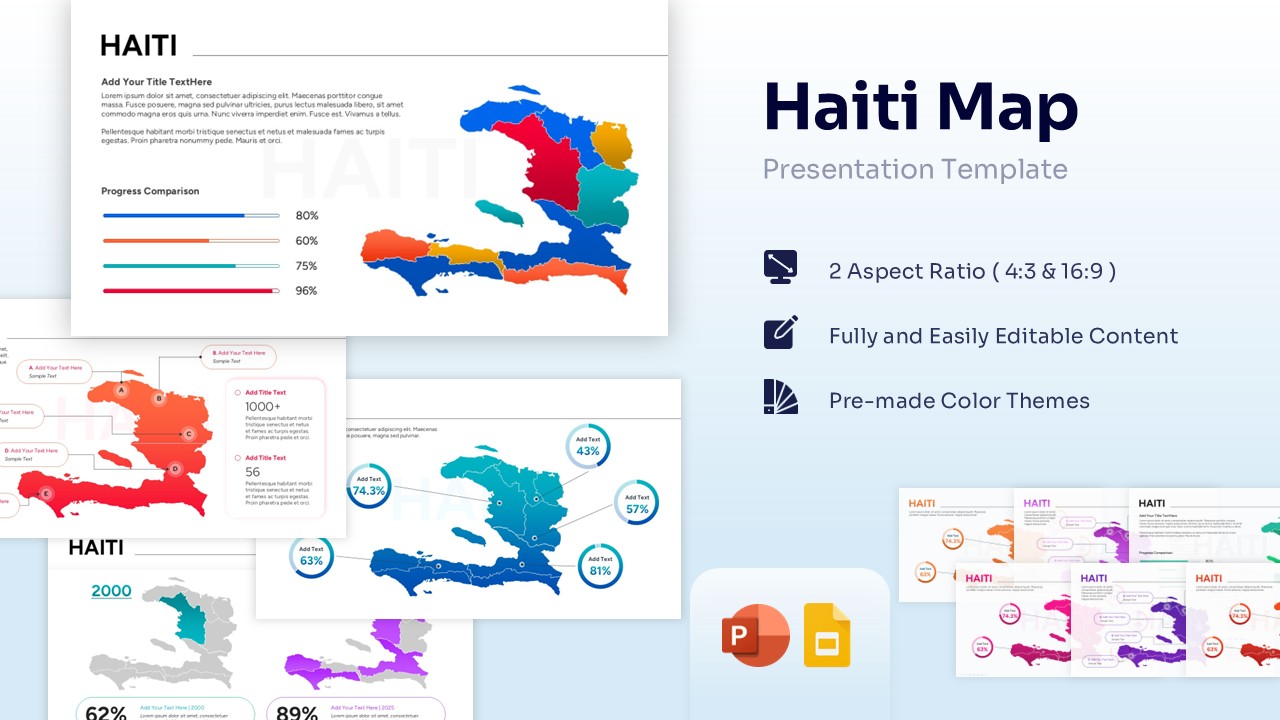
- Does this template support both 4:3 and 16:9 aspect ratios?
- Yes, the template is optimized for both standard and widescreen formats to ensure it fits perfectly on any projector or monitor screen.
Related Templates
-
-
 Free
Free -
 Free
Free -
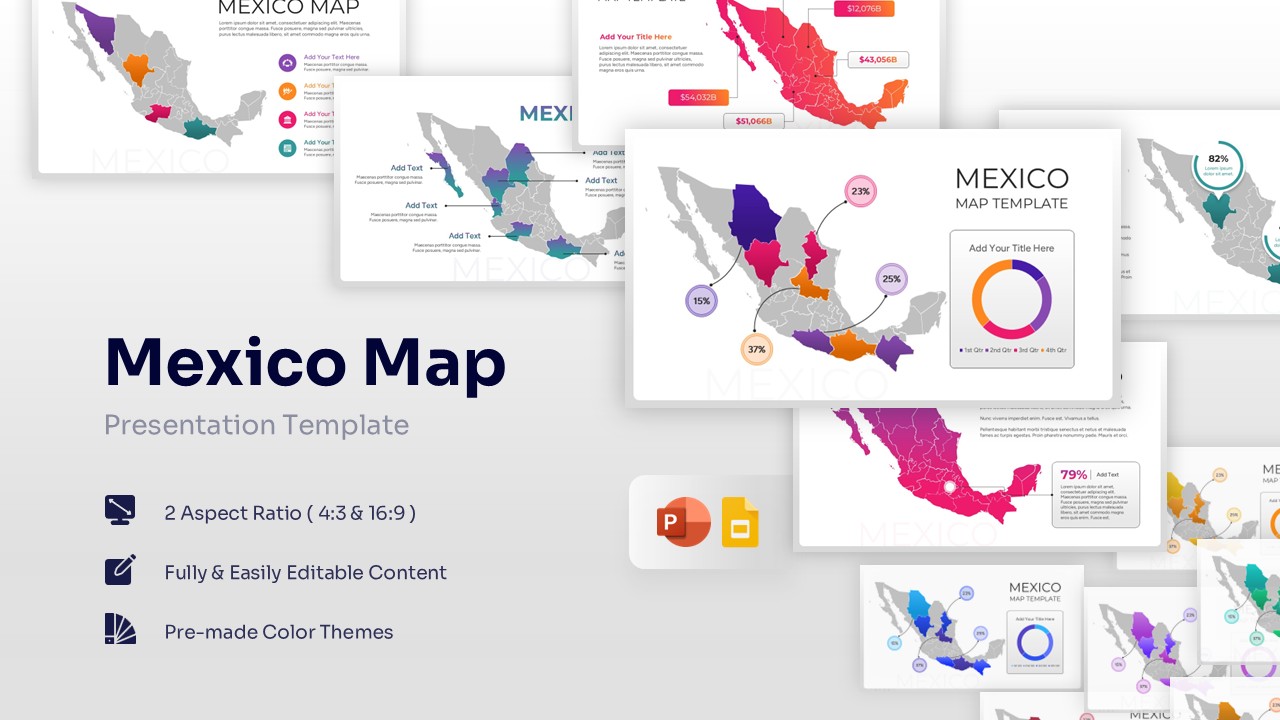
Free Mexico Map for PowerPoint & Google Slides
Country Maps
Free