Free Modern Data Table Template for PowerPoint & Google Slides


Editable Comparison Chart Presentation Template
Download this Table Presentation Template and use it for streamlining complex information, feature comparisons, and pricing structures into easily digestible visual formats. In today’s fast-paced corporate environment, capturing your audience’s attention requires more than just raw numbers; it demands an aesthetic and highly structured approach to data visualization. By leveraging this dynamic data comparison layout, you can effortlessly highlight pros and cons, track project milestones, and map out strategic initiatives without overwhelming your stakeholders.
The 100% vector-based graphics ensure seamless customization, allowing you to instantly adapt theme colors, typography, and icon placements to align perfectly with your corporate brand guidelines. Whether you are launching a new software product, pitching seed funding, or presenting a quarterly review, utilizing a clear table presentation template transforms cluttered information into compelling narratives.
Elevate your professional communication, secure stakeholder buy-in, and drive actionable decision-making, ultimately helping you scale your business to new heights.
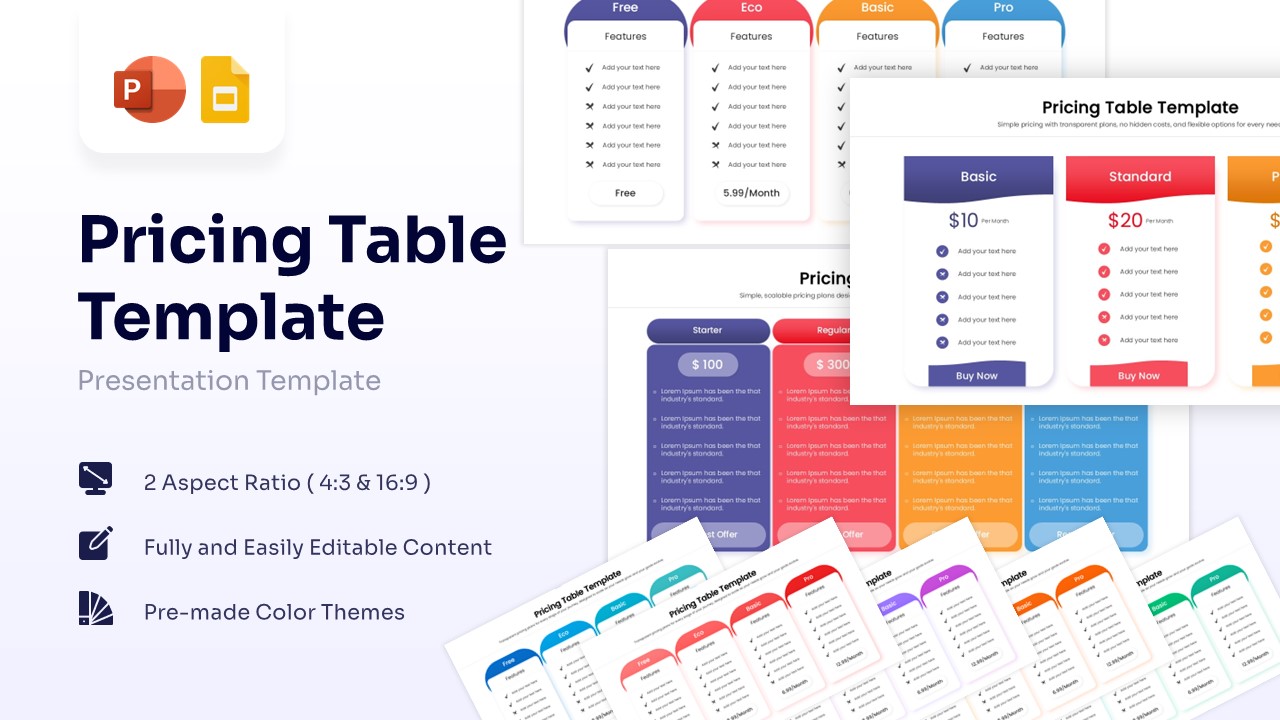
Key Features
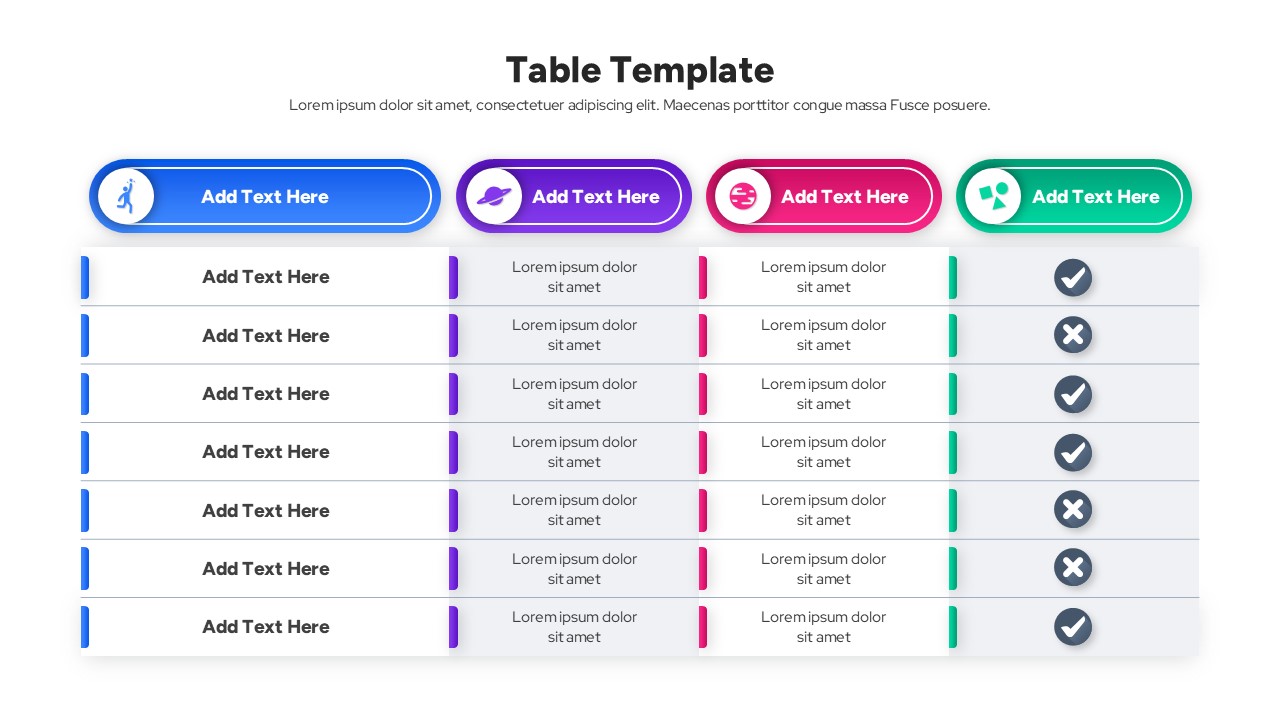
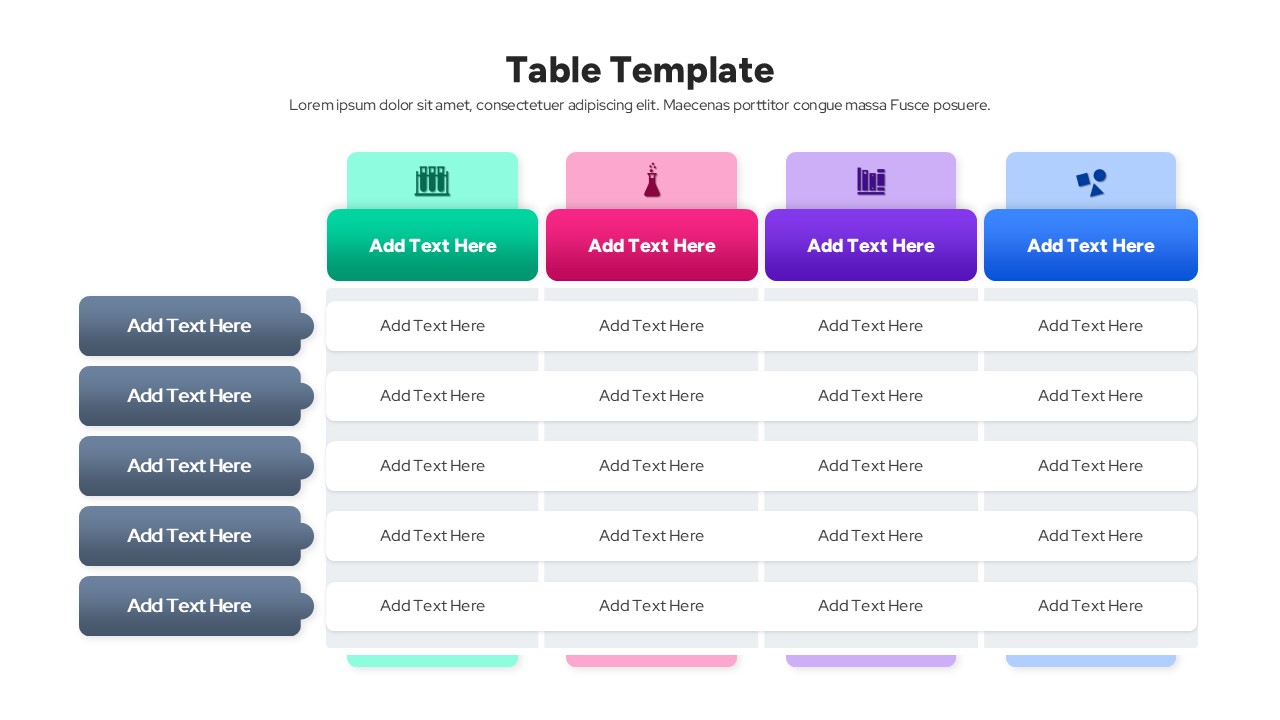
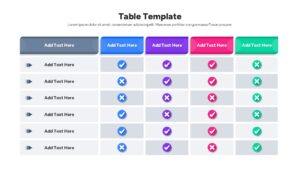
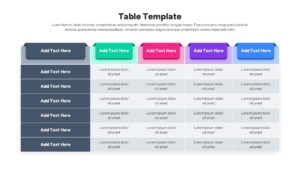
- Clean grid layouts designed to organize text and numerical data effectively.
- Includes variations with checkmark and cross icons for clear comparisons.
- Pre-made color themes
- Fully editable shapes, fonts, and colors
- Available in both 4:3 (Standard) and 16:9 (Widescreen) aspect ratios.
- Compatible with PowerPoint and Google Slides
Frequently Asked Questions
- Can I change the colors of the table rows?
- Yes, every element in this template is fully editable, allowing you to change colors to match your brand identity.
Related Templates
-
-
-
 Free
Free -