Free Break Even Analysis Template for PowerPoint & Google Slides


Present Financial Viability and Profitability Insights with a Break-even Analysis Template
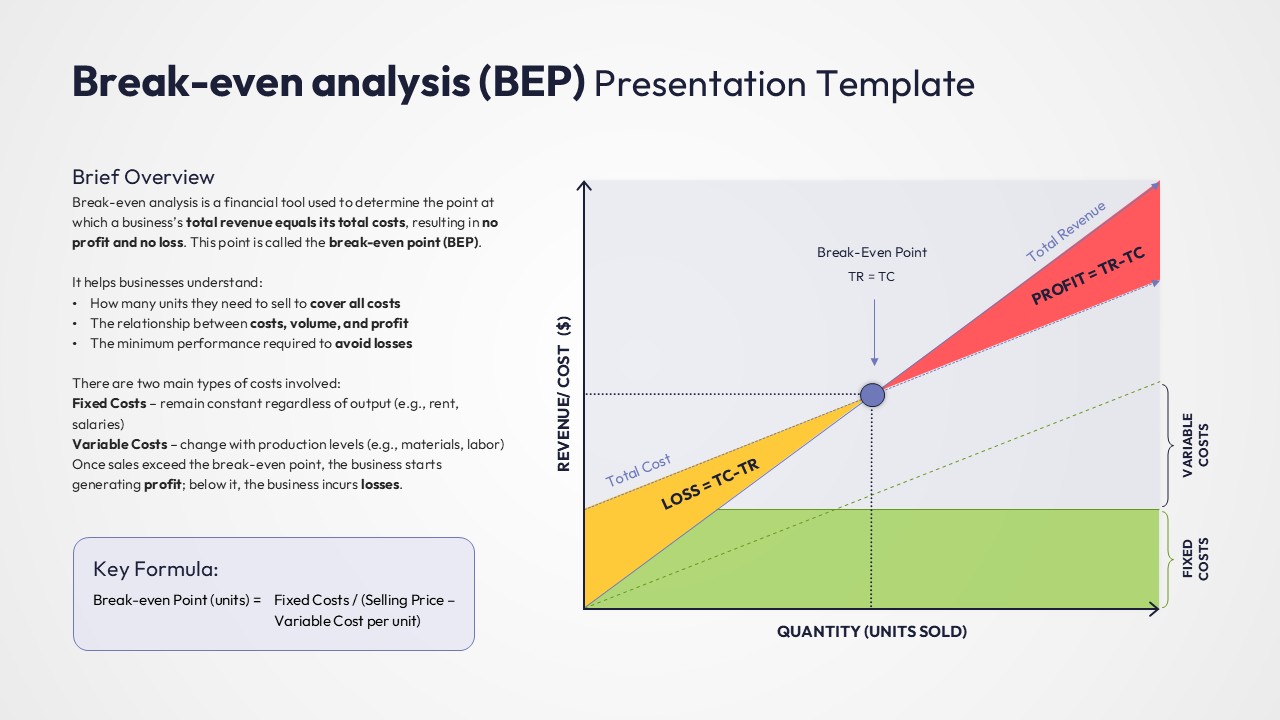
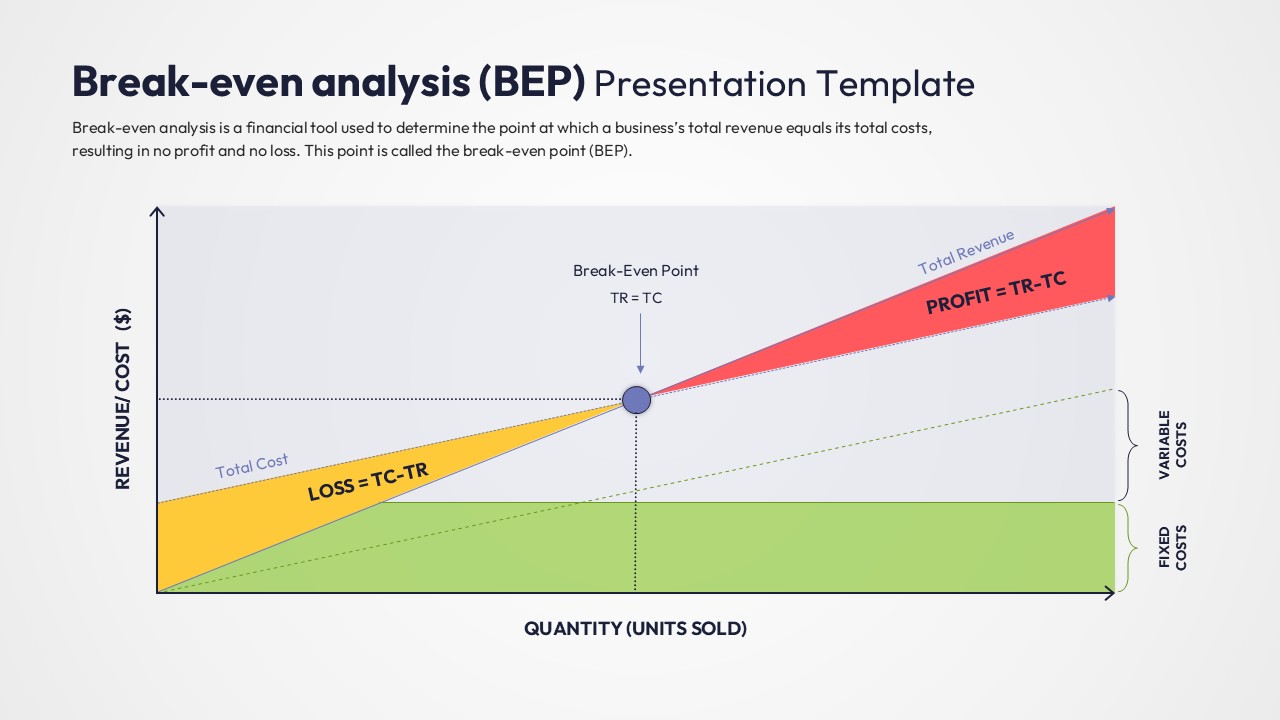
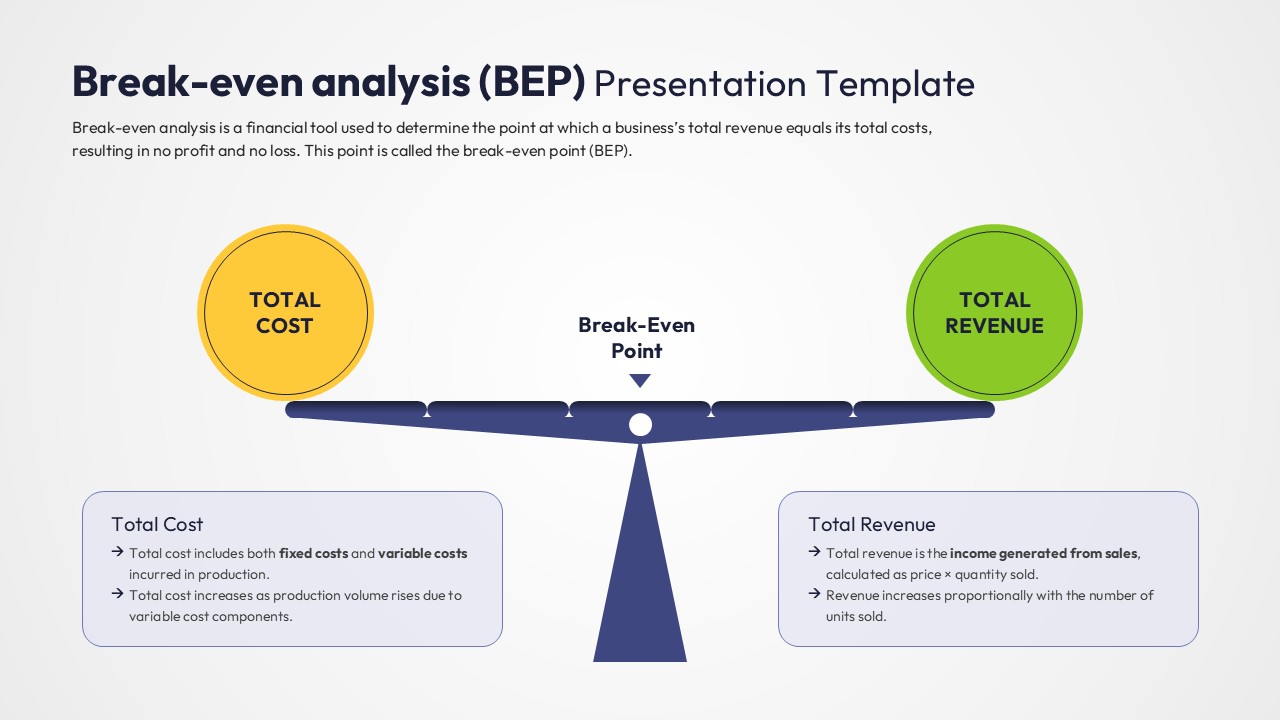
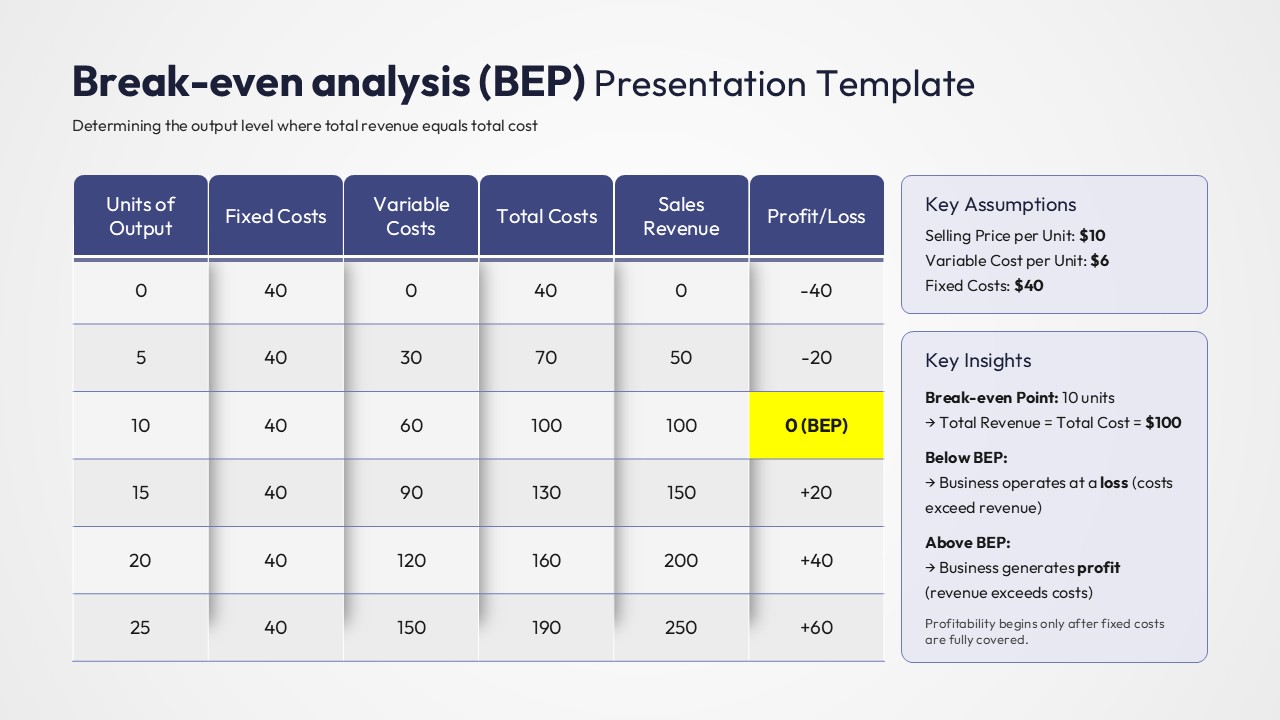
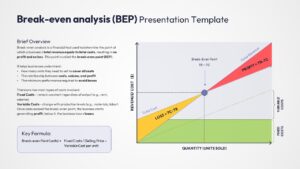
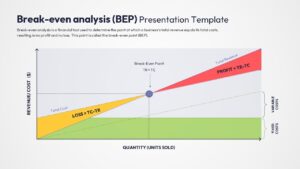
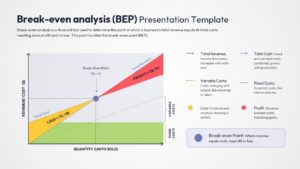
The Free Break-Even Analysis Template helps businesses determine when revenue equals total costs and profitability begins. It provides a clear way to visualize financial performance and support informed business decisions.
Whether you are preparing investor presentations, evaluating new opportunities, or reviewing financial performance, these slides simplify complex calculations. As a result, stakeholders can quickly understand profitability thresholds and revenue targets.
The presentation includes break-even charts, cost-volume-profit analysis, revenue and cost comparisons, profitability models, and financial forecasting layouts. In addition, the visual frameworks help explain fixed costs, variable costs, sales volume requirements, and margin of safety concepts.
Key topics covered include:
- Break-even point analysis
- Cost-volume-profit analysis
- Revenue versus cost evaluation
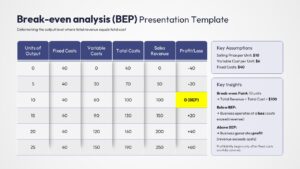
- Profitability assessment
- Financial forecasting
- Sales performance analysis
- Pricing and cost structures
The professional layouts transform financial data into clear and engaging visuals. Furthermore, these slides work well alongside comprehensive financial summary reports to provide a broader view of business performance. They can also complement a strategic business plan presentation when discussing growth projections, investment opportunities, and financial planning.
Fully editable in PowerPoint and Google Slides, users can customize charts, graphs, formulas, colors, and financial metrics. Financial analysts, entrepreneurs, consultants, educators, and business leaders can use this template to present break-even calculations and profitability insights with confidence. Also discover more visual presentation designs in our extensive Free Infographics Template collection.
Key Features
- 100% Vector-Based Graphics
- Fully Layered & Organized
- Multi-Platform Support
- Theme Color & Theme Font
- Interactive Break-even Chart Logic
- Detailed Cost-Benefit Data Tables
Frequently Asked Questions
- How do I adjust the break-even point in this profit and loss visualization?
- Since the graphics are vector-based, you can simply click and drag the intersection point and the revenue/cost lines to align with your specific data calculations.
- Is the data table in this BEP presentation layout Excel-linked?
- The table is built natively in PowerPoint/Google Slides for easy manual entry, but you can copy and paste data directly from Excel while maintaining the professional formatting.
- Can I change the colors of the Profit and Loss zones?
- Yes, the green \"Profit\" and yellow \"Loss\" areas are separate shapes that can be recolored using the \"Shape Fill\" tool to match your specific corporate brand guidelines.
Related Templates
-
 Free
Free -
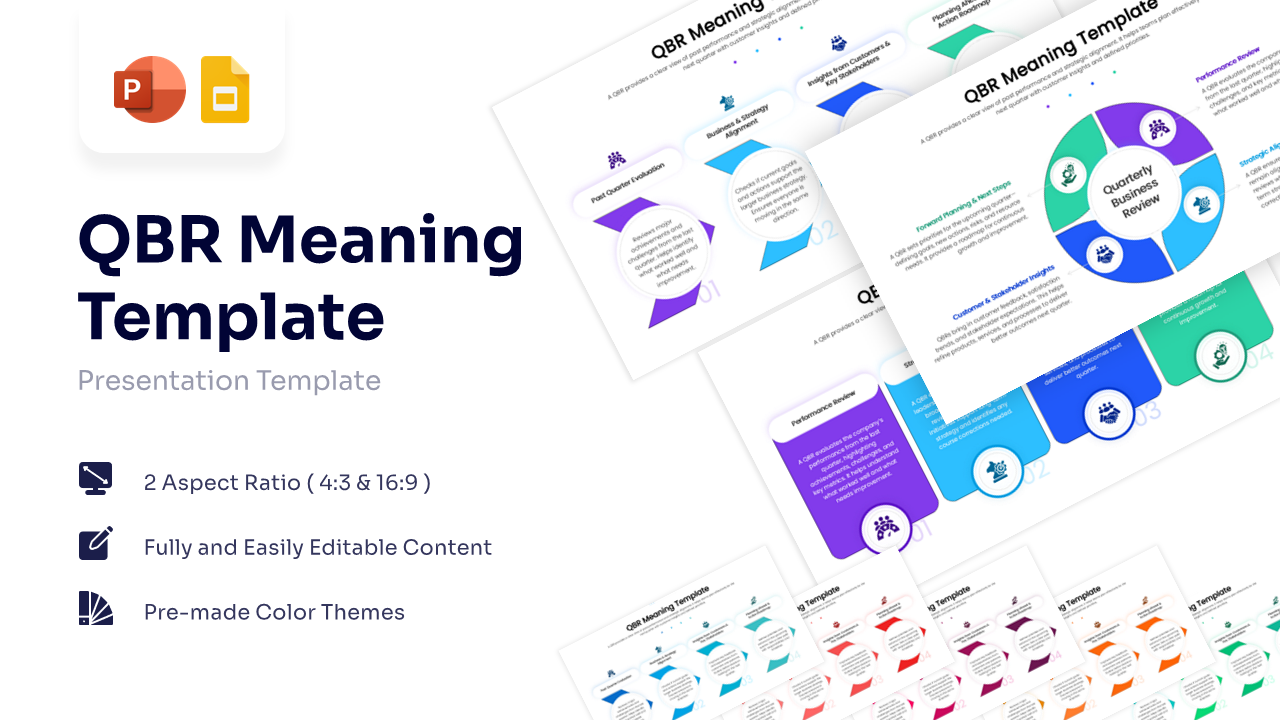
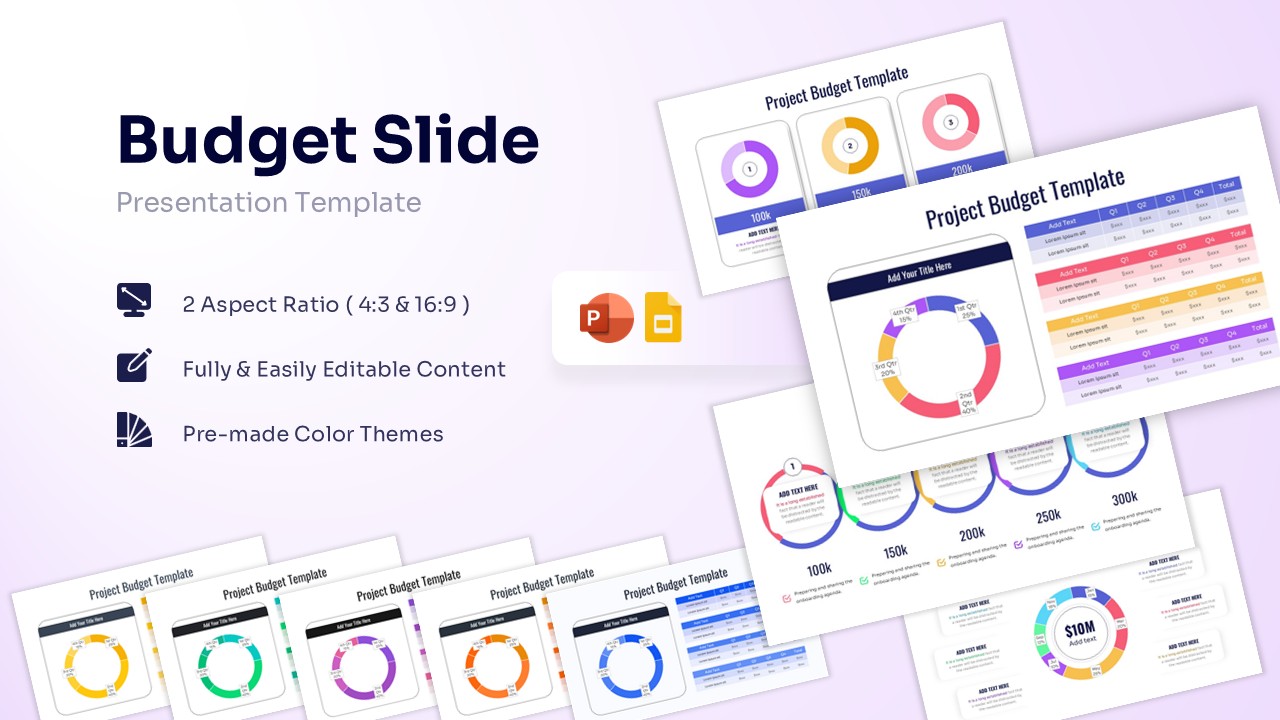
Quarterly Business Review Infographic
Annual Report
Free -
-
 Free
Free