Free Quadrant Chart Template for PowerPoint & Google Slides
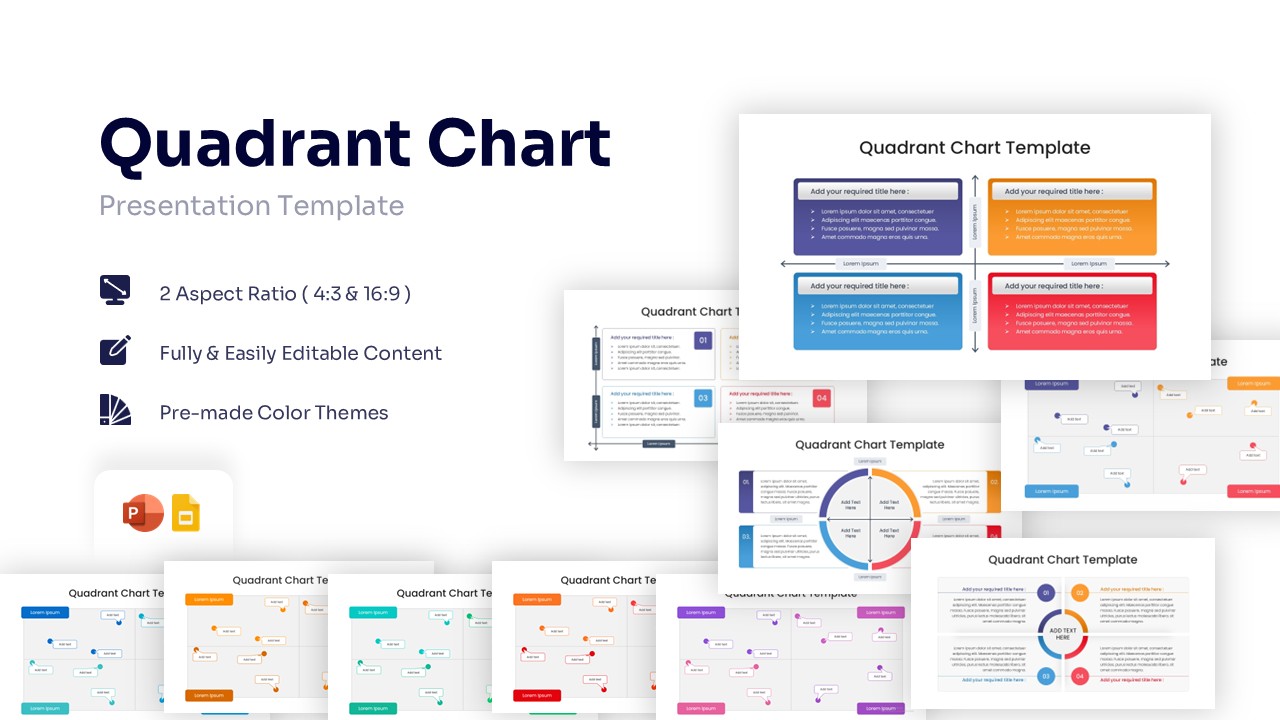


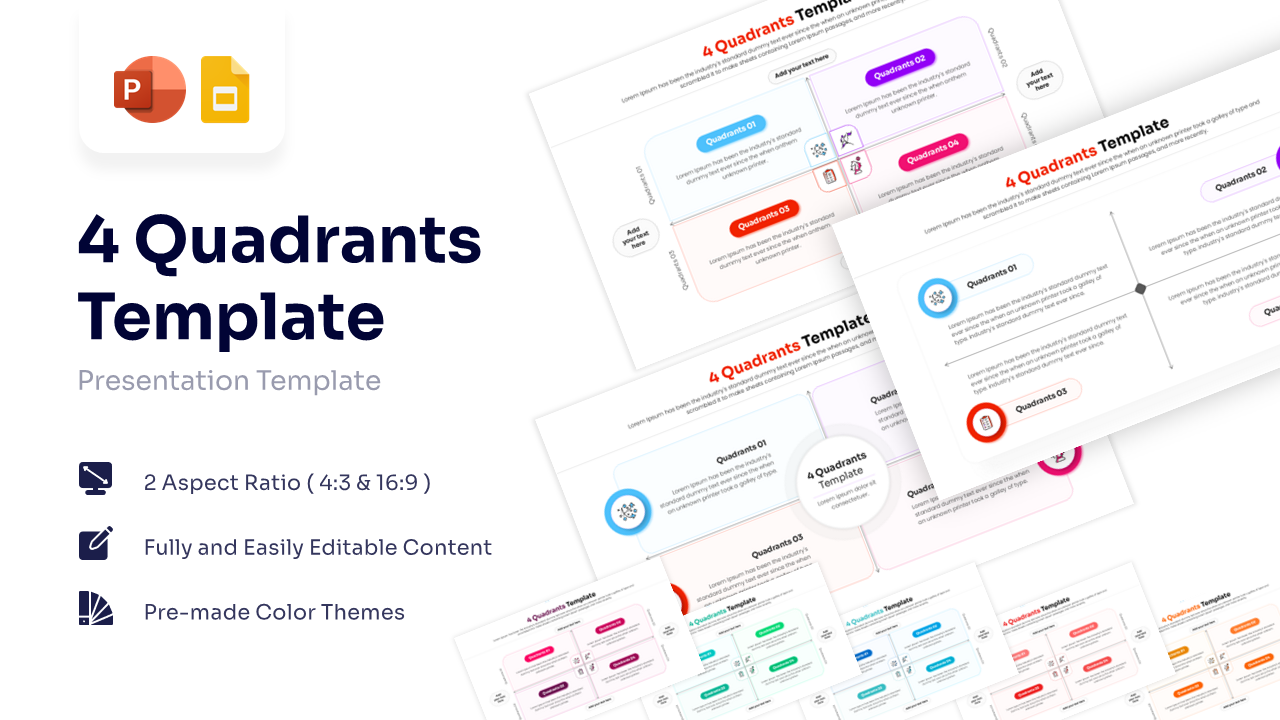
Visualize Strategy with a 4 Part Matrix Slide
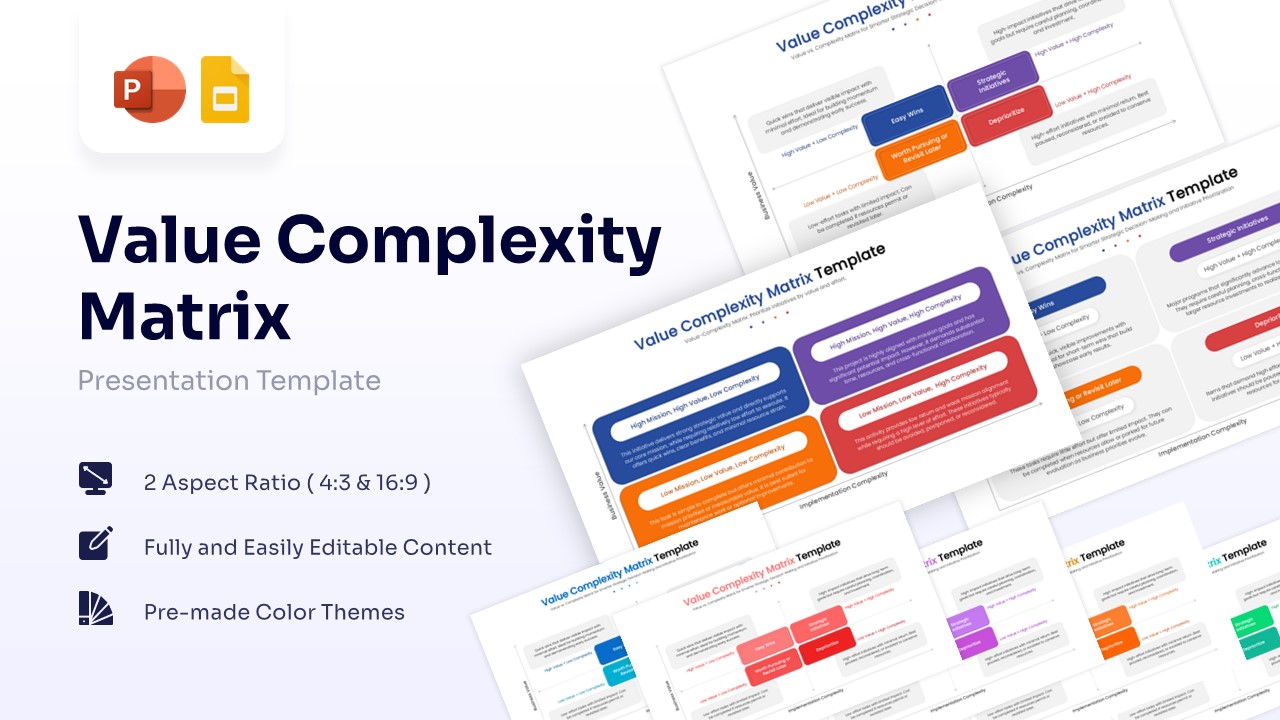
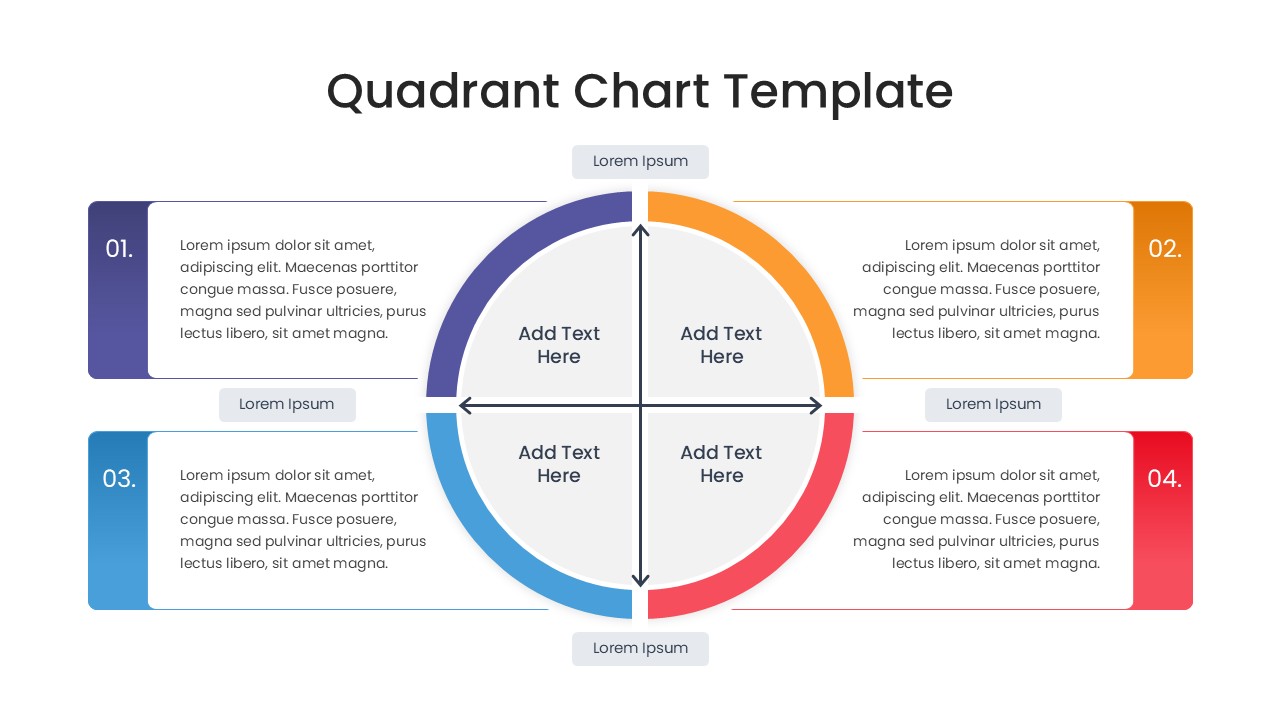
Elevate your strategic planning sessions with this dynamic quadrant chart presentation. This well-structured Quadrant Chart Strategy Matrix makes it incredibly simple to categorize data, assess risks, and visually map out organizational priorities across a four-section grid. It is an ideal asset for project managers and consultants needing to plot out comprehensive business strategy analysis during critical stakeholder meetings. Fully adaptable and compatible with PowerPoint, Keynote, and Google Slides, it guarantees a smooth integration into your next big pitch.
Key Features
- 100% Vector-Based Graphics
- Fully Layered & Organized
- Multi-Platform Support
- Theme Color & Theme Font
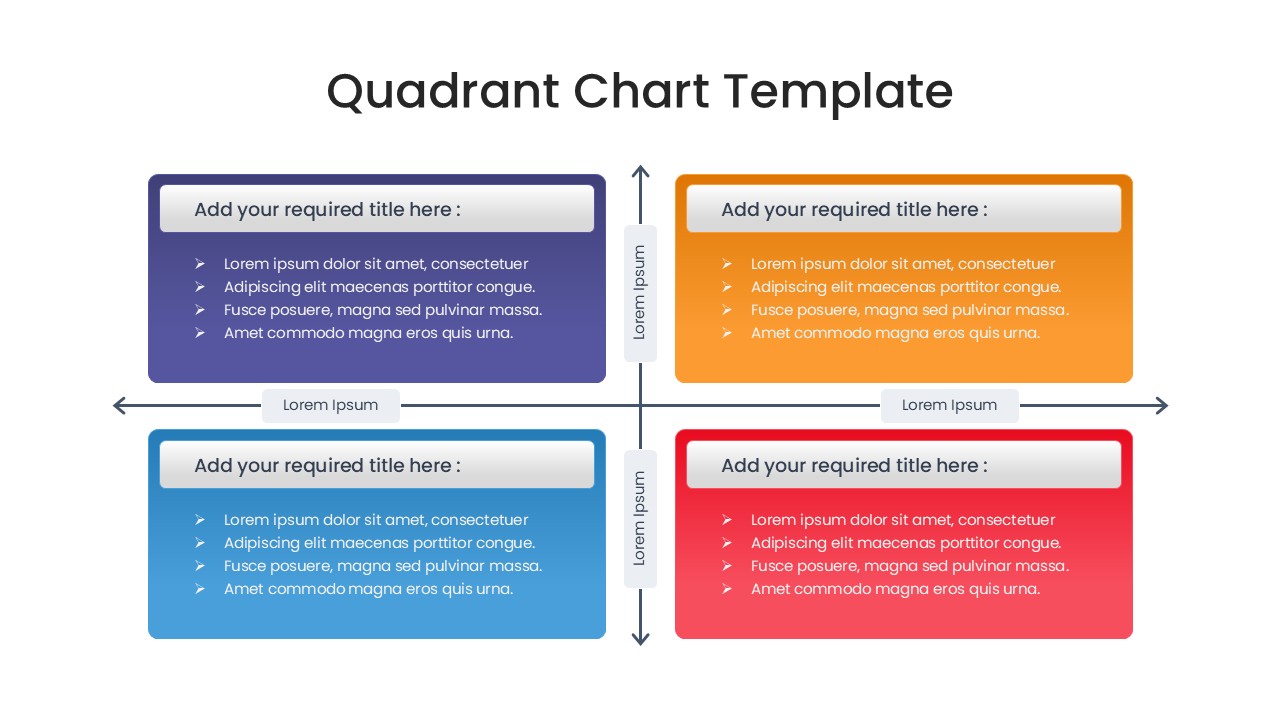
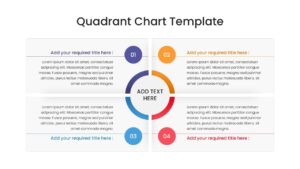
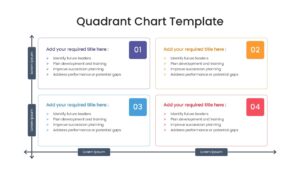
- Versatile 2x2 Matrix Layouts
Frequently Asked Questions
- Can I change the colors of the quadrants?
- Yes, every element in this Quadrant Chart is fully editable. You can easily change the colors to match your company branding or specific category themes directly in PowerPoint or Google Slides.
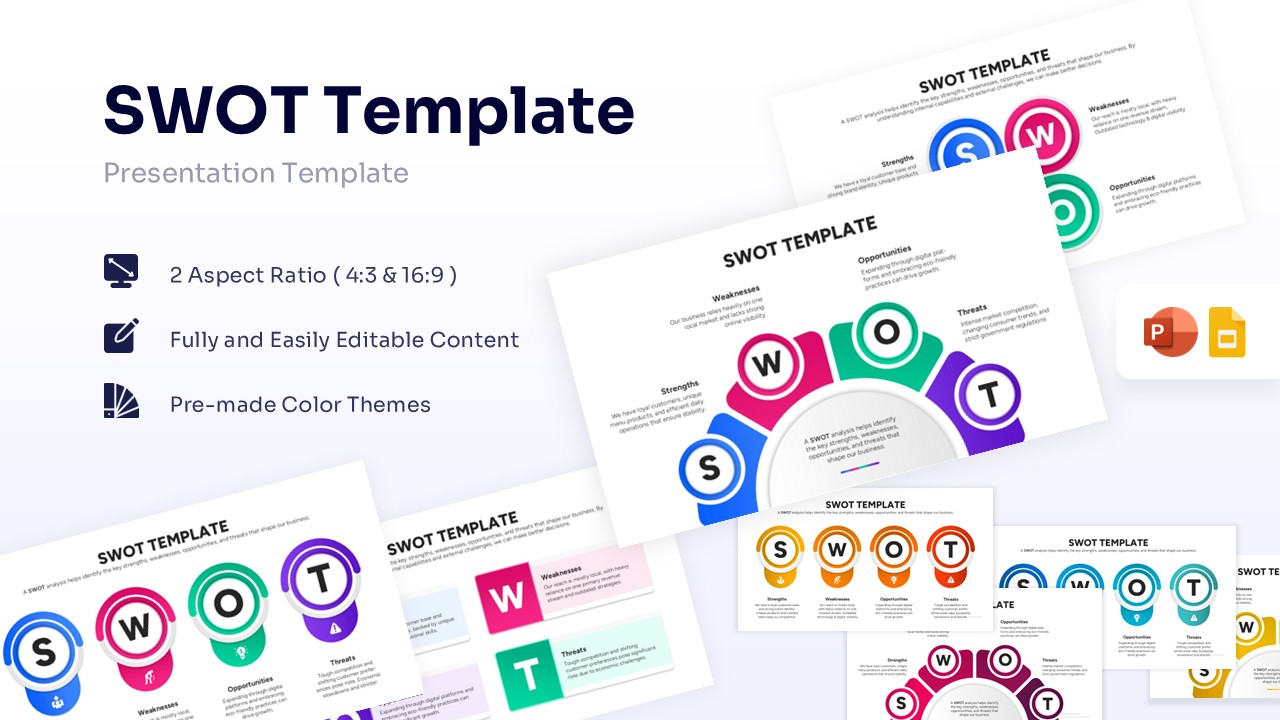
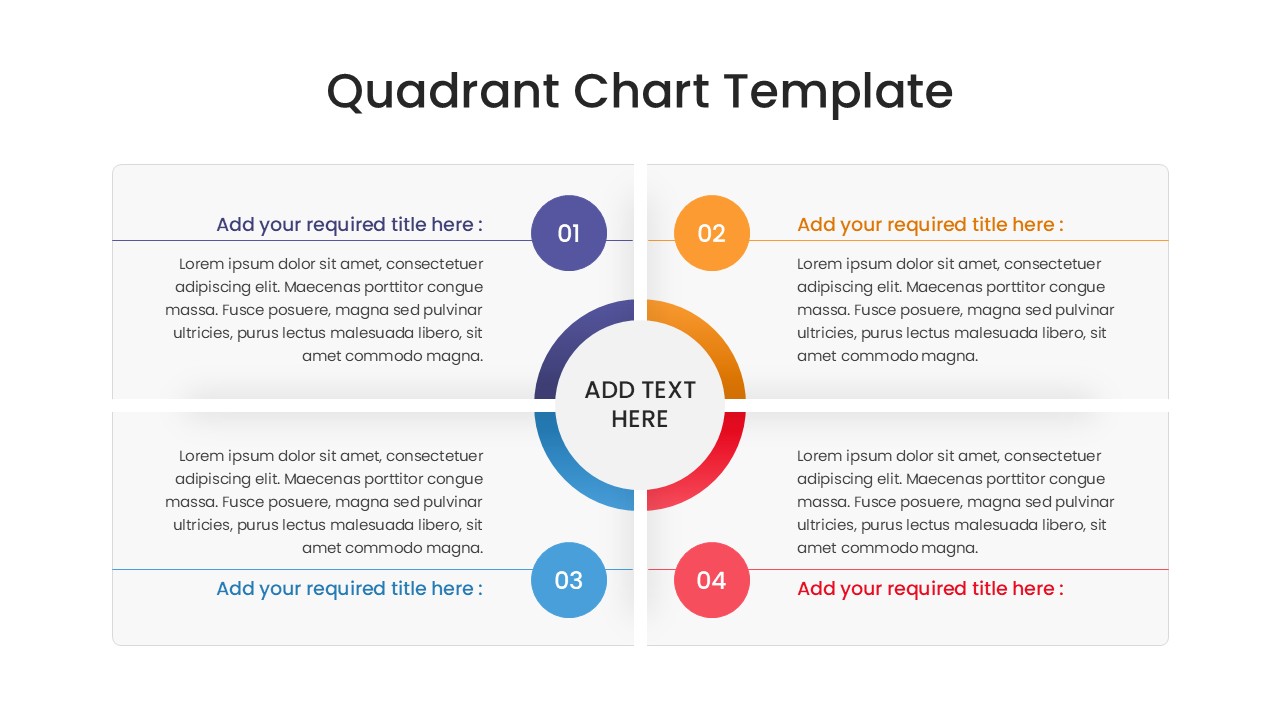
- Is this template suitable for a SWOT analysis?
- Absolutely. The four-quadrant structure is perfect for SWOT analysis (Strengths, Weaknesses, Opportunities, Threats), as well as PESTLE analysis or risk assessment matrices.
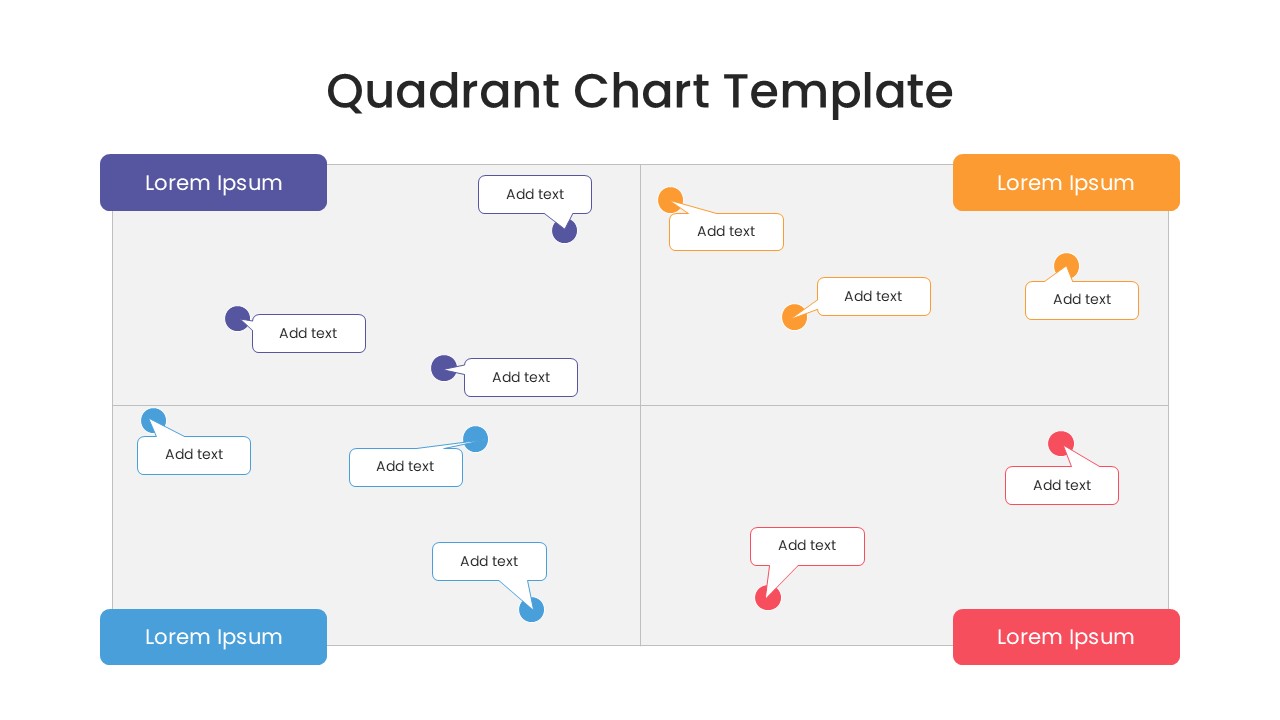
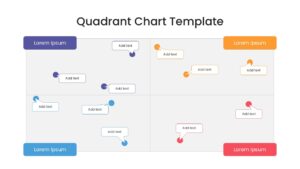
- How do I edit the data in the scatter plot slide?
- The scatter plot elements are individual vector shapes. You can simply click and drag the \"pins\" or text bubbles to position them anywhere on the grid that reflects your data.