Free Stakeholder Analysis Template for PowerPoint & Google Slides
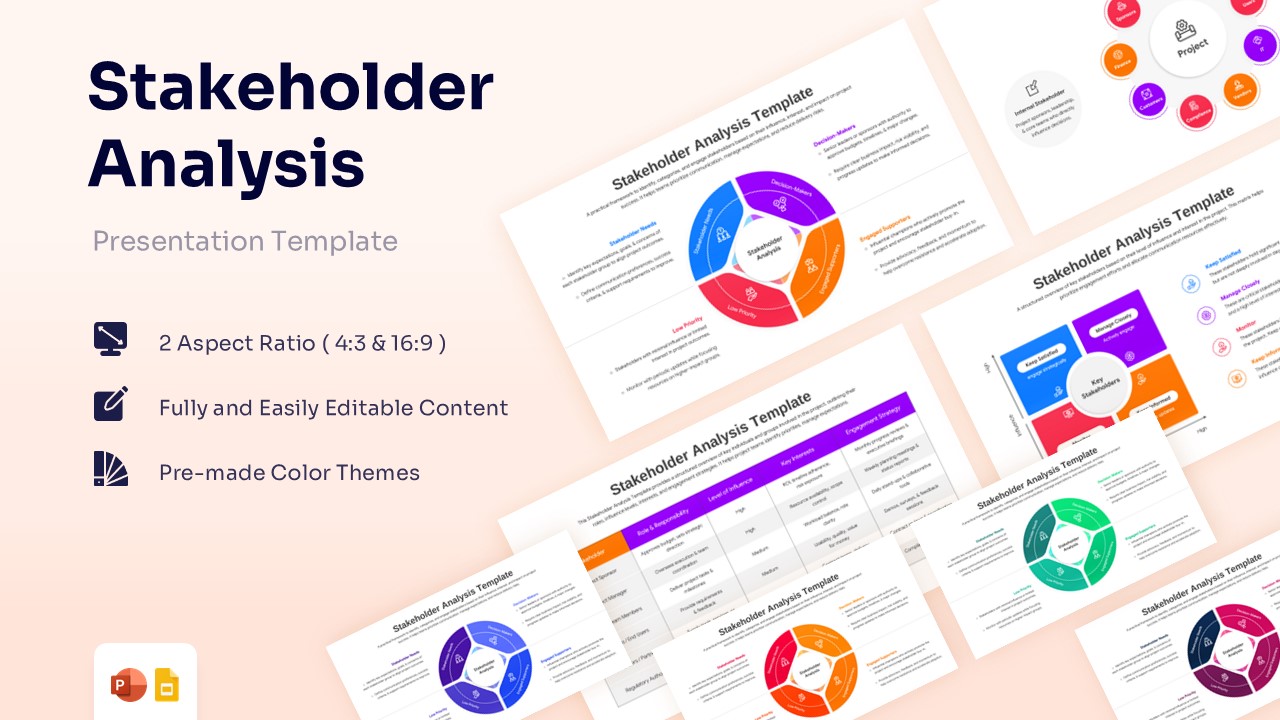


Comprehensive Stakeholder Mapping Matrix Design
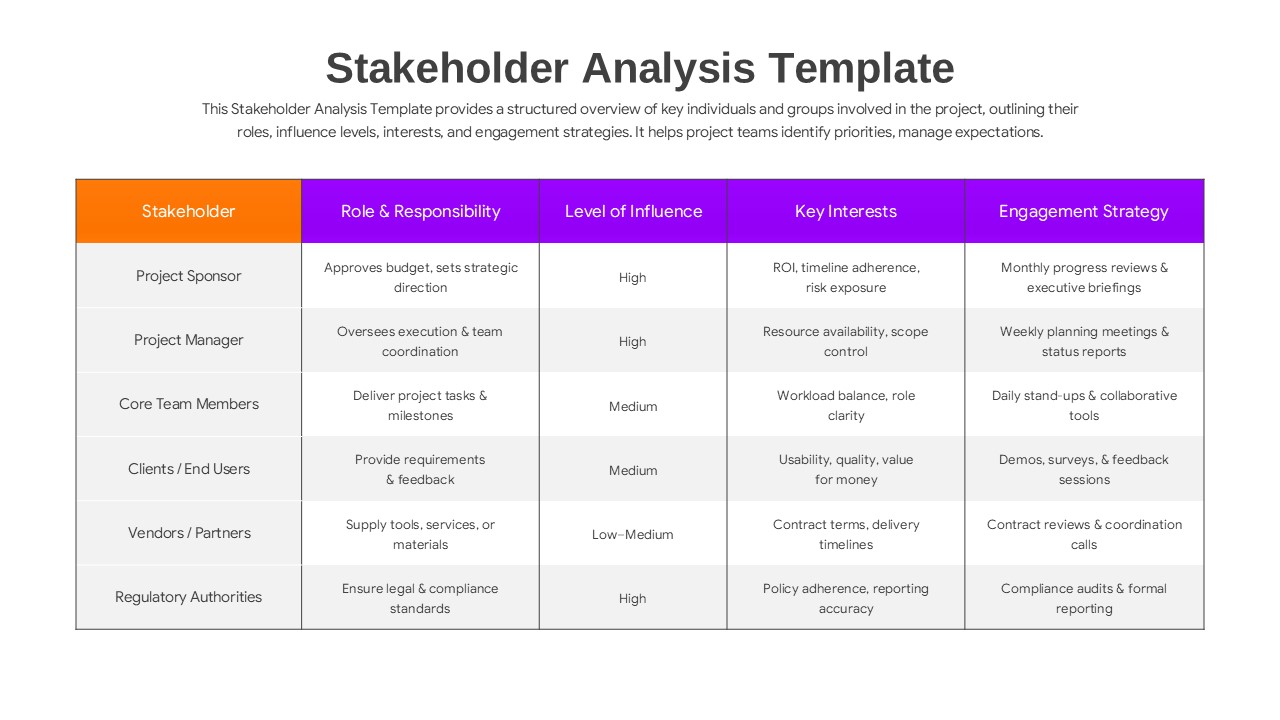
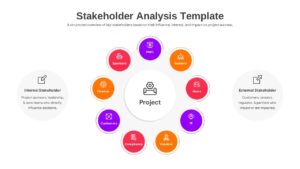
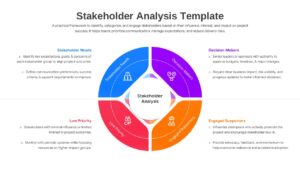
The Free Stakeholder Analysis Template is a structured presentation design created to illustrate project involvement using a strategic classification flow. This business analysis infographic visually maps stakeholder influence, project interest, and engagement levels in a connected format. It includes labeled sections for distinct stakeholder categories and responsibilities. This stakeholder map template shows how these components move through an analytical process to produce targeted engagement strategies. The design supports strategic project management discussions, team alignment, and risk assessment review. Matrix charts and circular hubs help present system relationships in a clear sequence. The slide keeps technical information organized without overcrowding the layout.
What Is This Stakeholder Analysis Template?
This Free Stakeholder Analysis Infographic is a ready-made slide built to present stakeholder classification in a visual format. It organizes key components such as internal roles, external partners, and decision-makers into a logical flow. The template highlights how these inputs move into a structured engagement process. It visually represents strategic decisions through clear mapping outputs. The layout helps teams explain architecture in a structured way. It serves as a business presentation template for project management frameworks.
When to Use This Stakeholder Analysis Diagram
Use this infographic template when presenting project resource allocation models, communication planning, or risk management strategies. It is suitable for project kickoff meetings, quarterly business reviews, and executive strategy sessions. The layout supports clear explanation of stakeholder engagement flows to both technical and business audiences.
Customization and Editing Options
Users can edit all labels, headings, and descriptions in PowerPoint or Google Slides. Colors can be updated to match corporate branding. Diagram shapes and elements can be resized or repositioned to fit additional details. Matrix quadrants and tabular data rows can be adjusted to reflect organization-specific terminology. Additional slides can be duplicated to expand the explanation.
Key Features
- 100% Vector-Based Graphics
- Fully Layered & Organized
- Multi-Platform Support
- Theme Color & Theme Font
- Multiple Layout Variations including Matrix and Circular Diagrams
- Clean and Professional Corporate Design
Frequently Asked Questions
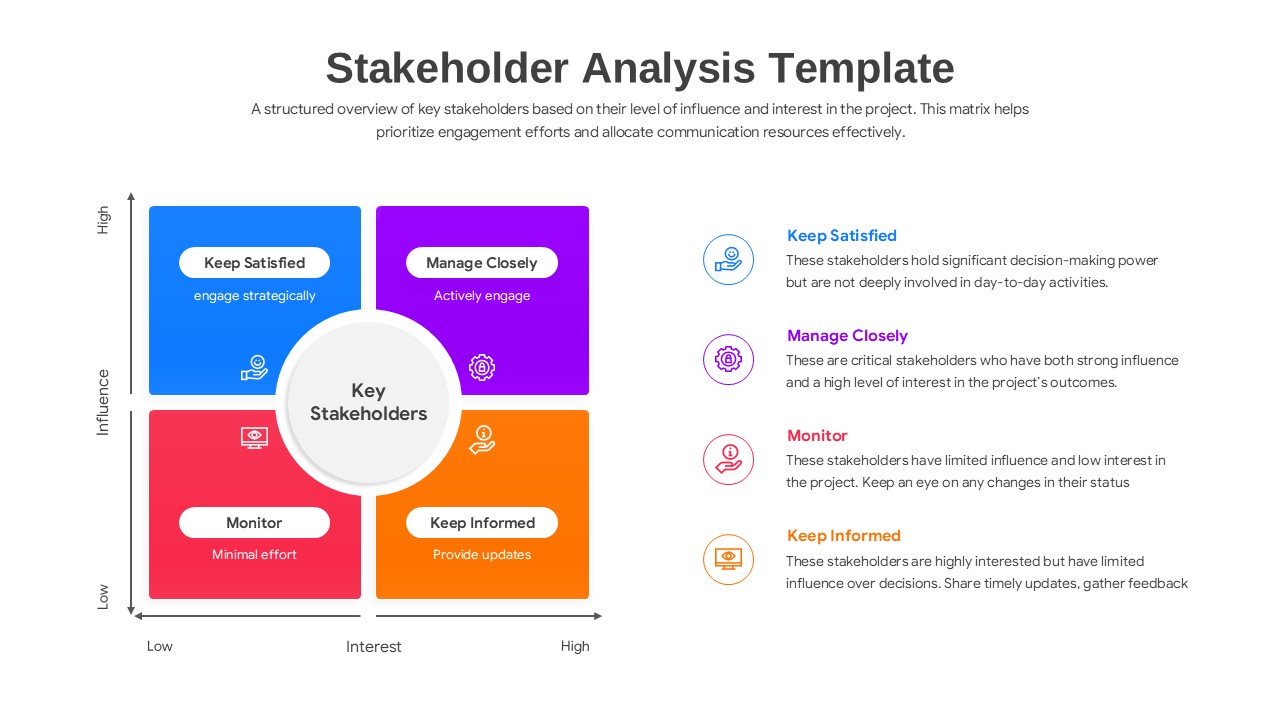
- How do I categorize stakeholders using this template?
- You can use the 2x2 matrix slide to plot individuals based on their influence and interest. Simply move the icons or text boxes into the relevant quadrant, such as \"Manage Closely\" for high-influence, high-interest groups.
- Can I change the colors to match my brand?
- Yes, the template is fully editable. You can update the theme colors and fonts within PowerPoint or Google Slides to align with your company’s branding in just a few clicks.
- Is this template suitable for both internal and external analysis?
- Absolutely. The circular diagram specifically includes segments for both internal stakeholders (like sponsors and PMOs) and external stakeholders (like vendors and regulators).
Related Templates
-
 Free
Free -
 Free
Free -
 Free
Free -
 Free
Free