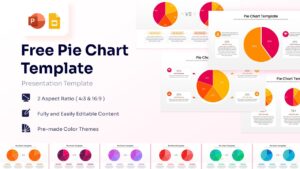
Free Editable Pie Chart Template PPT and Google Slides
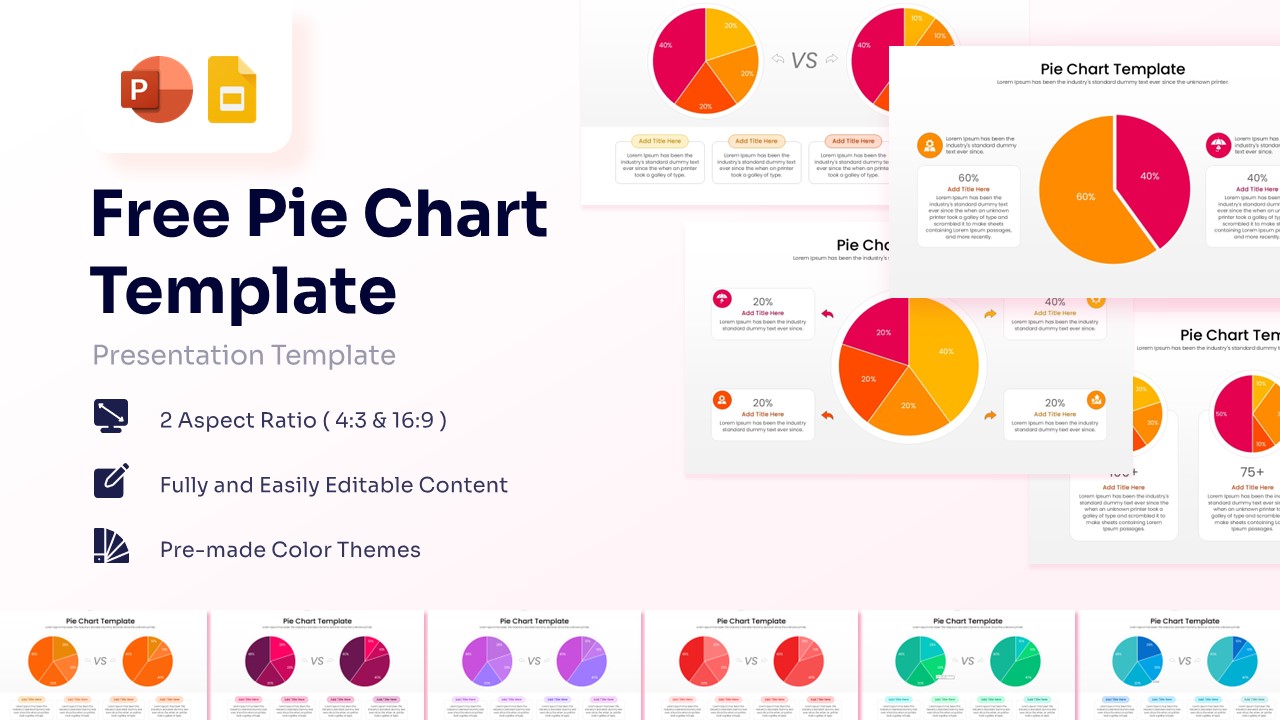
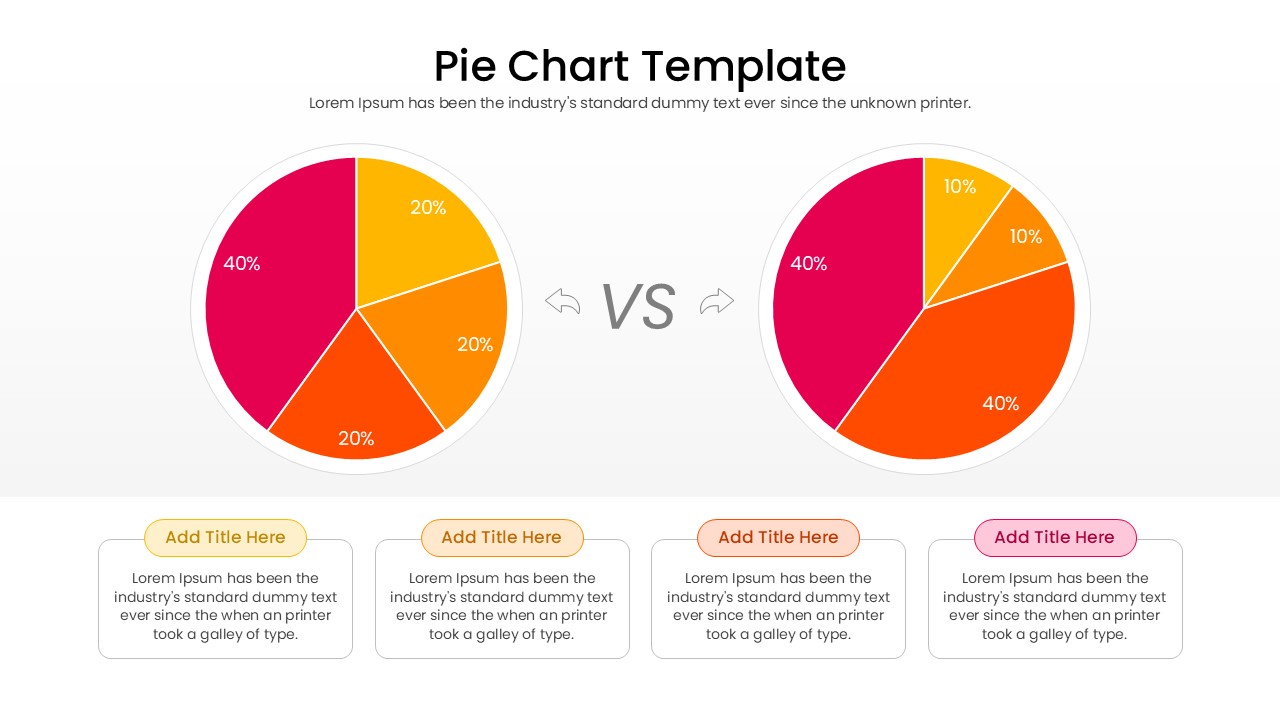

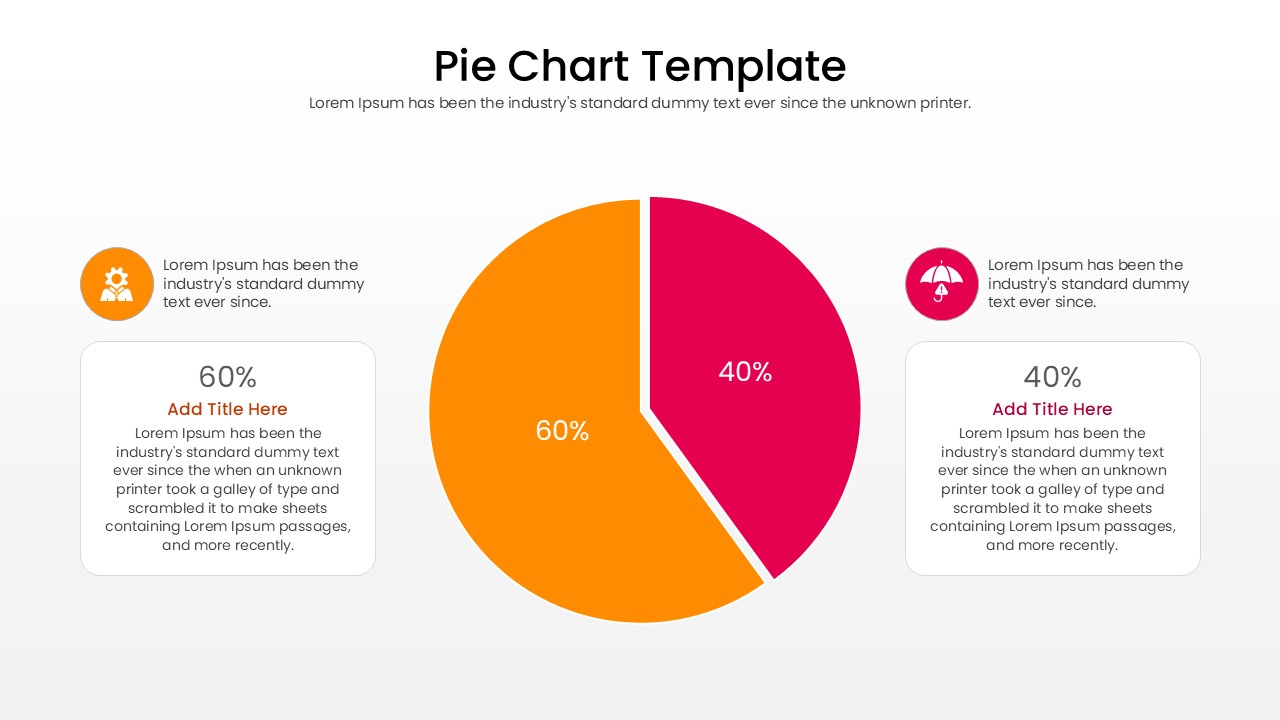


Data Comparison Pie Chart Presentation Template
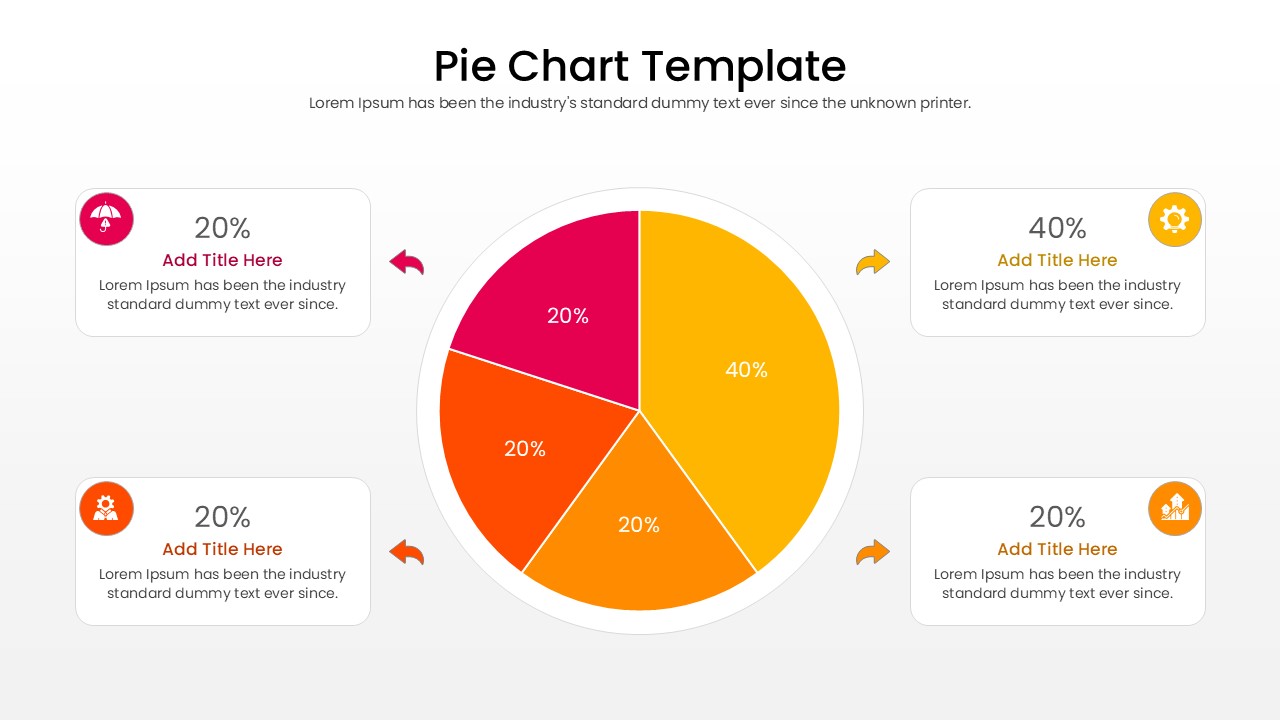
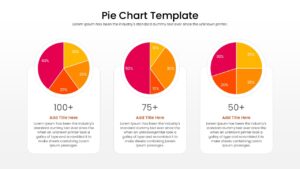
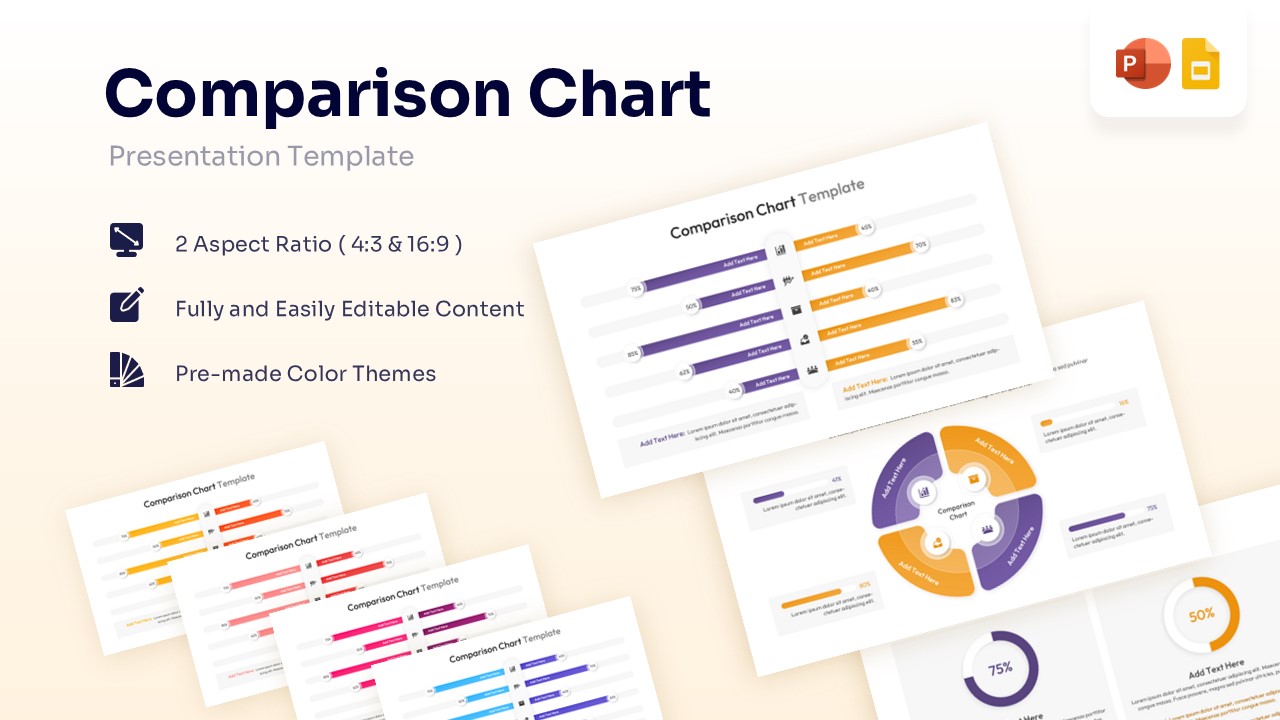
There is no quicker way to communicate part-to-whole relationships than through a vibrant, well-structured editable pie chart template. This free editable pie chart template serves as the visual anchor for percentage-based data, transforming an overwhelming list of numbers into an instantly digestible format. By dividing a full circle into distinct, color-coded proportional slices, this pie donut chart allow your audience to gauge relative sizes at a mere glance. Whether you are highlighting a dominant category or comparing smaller subsets, incorporating effective data visualization slides ensures your core message remains crystal clear and visually engaging without overwhelming the viewer.
These editable pie chart template are an absolute staple across virtually every professional industry, from marketing agencies reviewing quarterly demographic splits to academic researchers displaying survey feedback distributions. Financial planners frequently rely on them to map out portfolio allocations, while retail managers might use a multi-chart layout to track product category performance. Their widespread popularity stems from their innate ability to bridge the gap between complex statistical outputs and everyday comprehension. You can impress your audience with this sleek chart and graph template, delivering an informative presentation that looks effortlessly polished and entirely customized to your specific analytical needs.
Key Features
- 100% Vector-Based Graphics
- Fully Layered & Organized
- Multi-Platform Support
- Theme Color & Theme Font
Frequently Asked Questions
- Can I edit the percentage values in this pie chart template?
- Yes, every text box and data label is fully editable. You can simply click and type your specific figures to match your data.
- Does this template work with both 4:3 and 16:9 aspect ratios?
- Absolutely. We have included both standard and widescreen formats to ensure your presentation looks great on any projector or monitor.
- Can I change the colors to match my company branding?
- Yes, the template uses theme colors. You can change the entire color scheme with just a few clicks within PowerPoint or Google Slides settings.
Related Templates
-
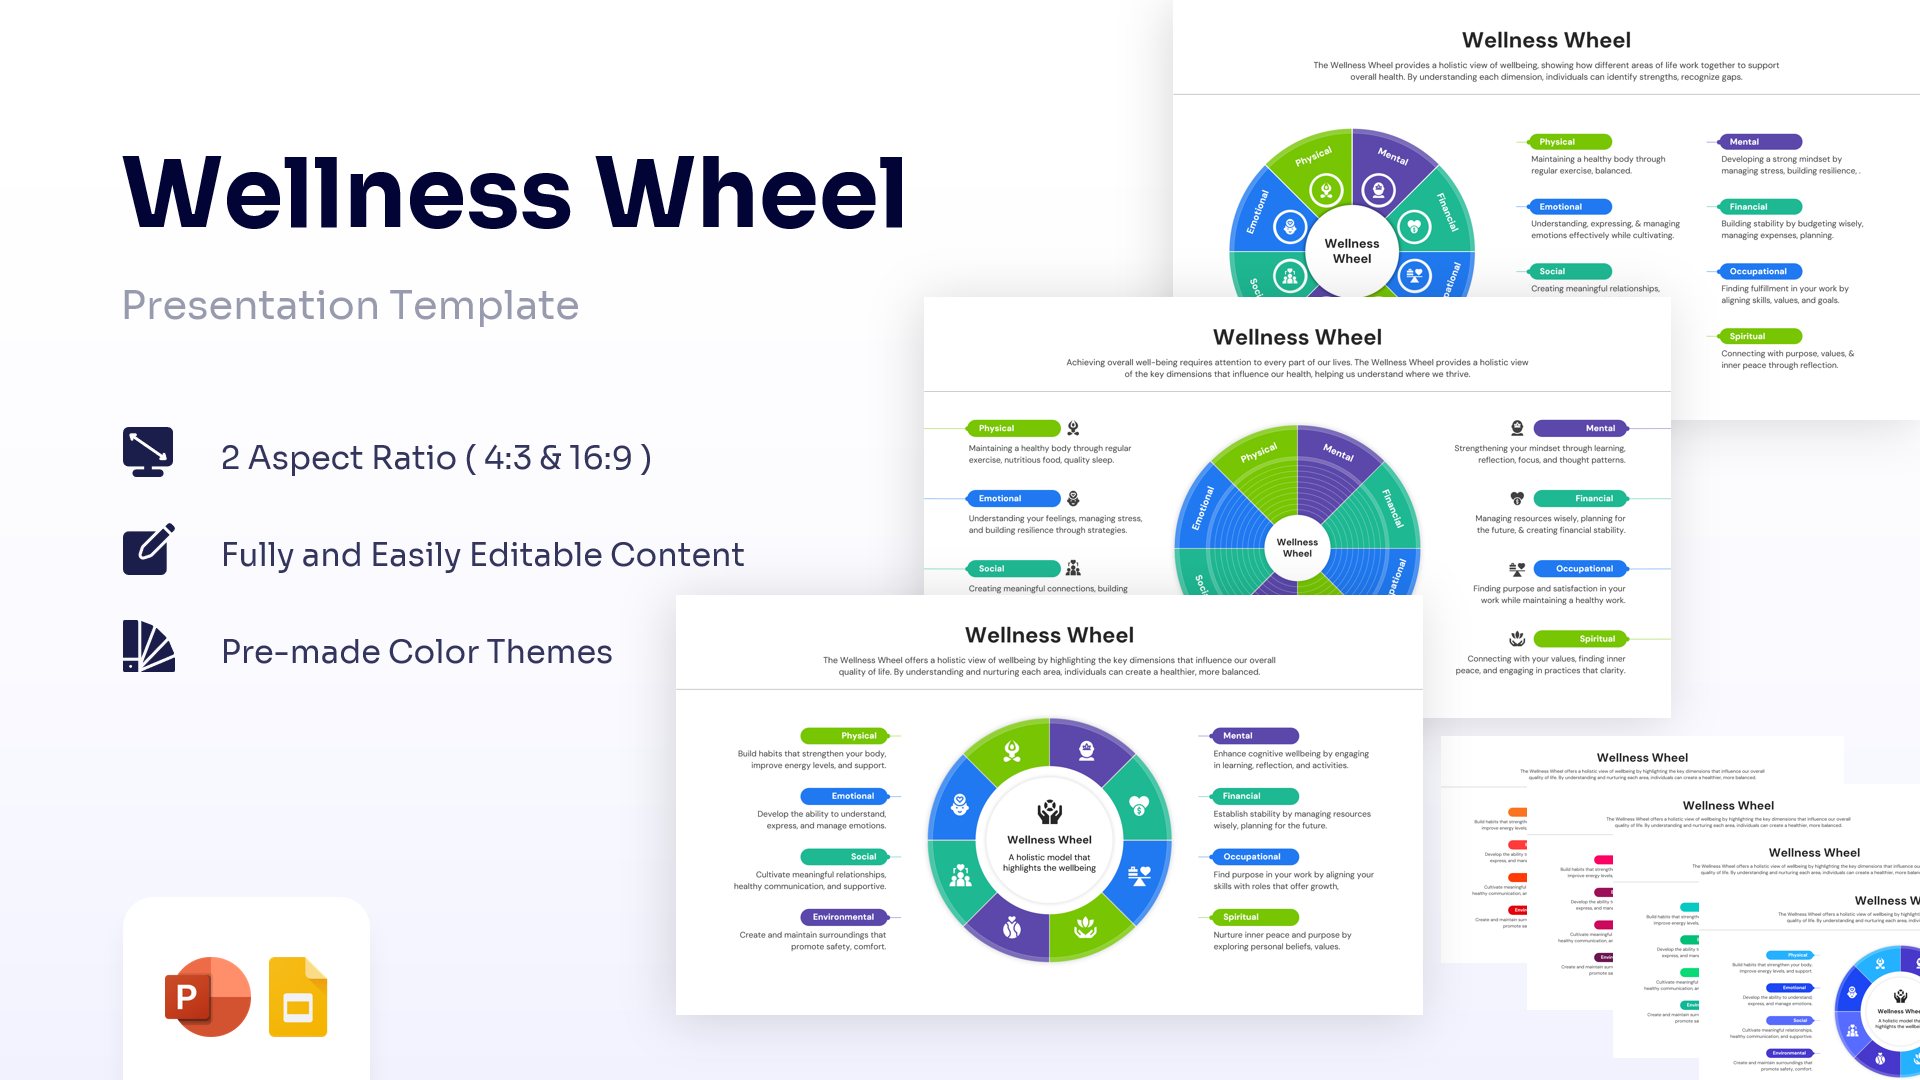
Wellness Wheel Infographic Template PPT & Google Slides
Charts & Graphs
Free -
 Free
Free -
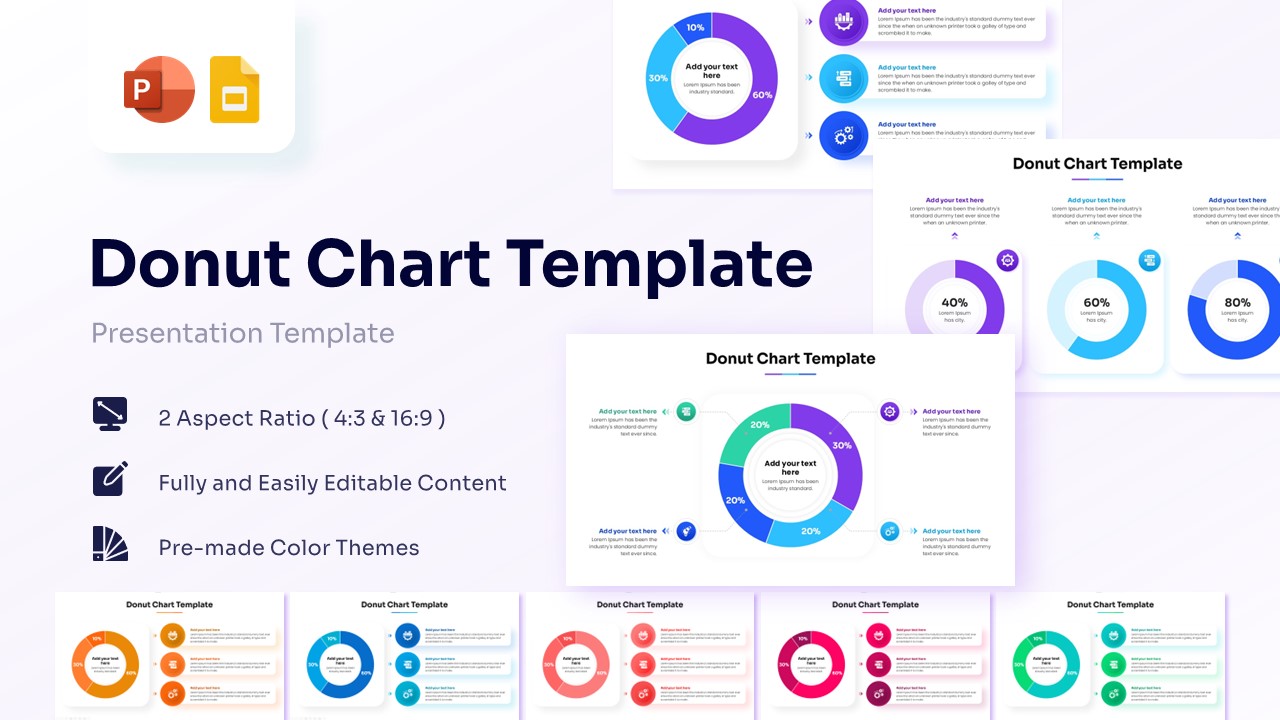
Free Donut Chart Template for PowerPoint & Google Slides
Charts & Graphs
Free -