Free Donut Chart Template for PowerPoint & Google Slides

Data Visualization Donut Chart Presentation Template
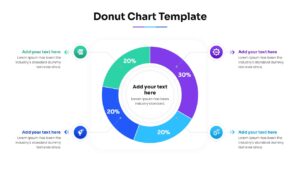
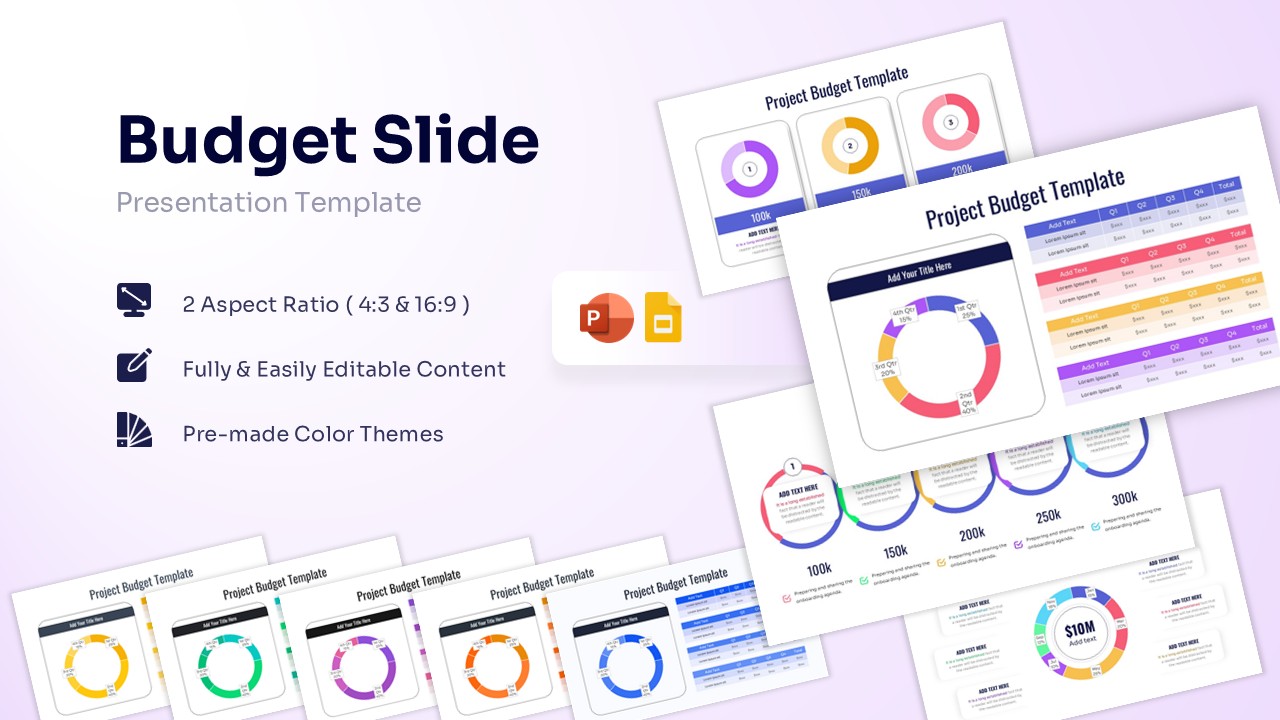
Presenting data effectively is the key to business success and clear corporate communication. Using high-quality visuals like this free donut chart template ensures your audience understands complex statistics at a single glance.
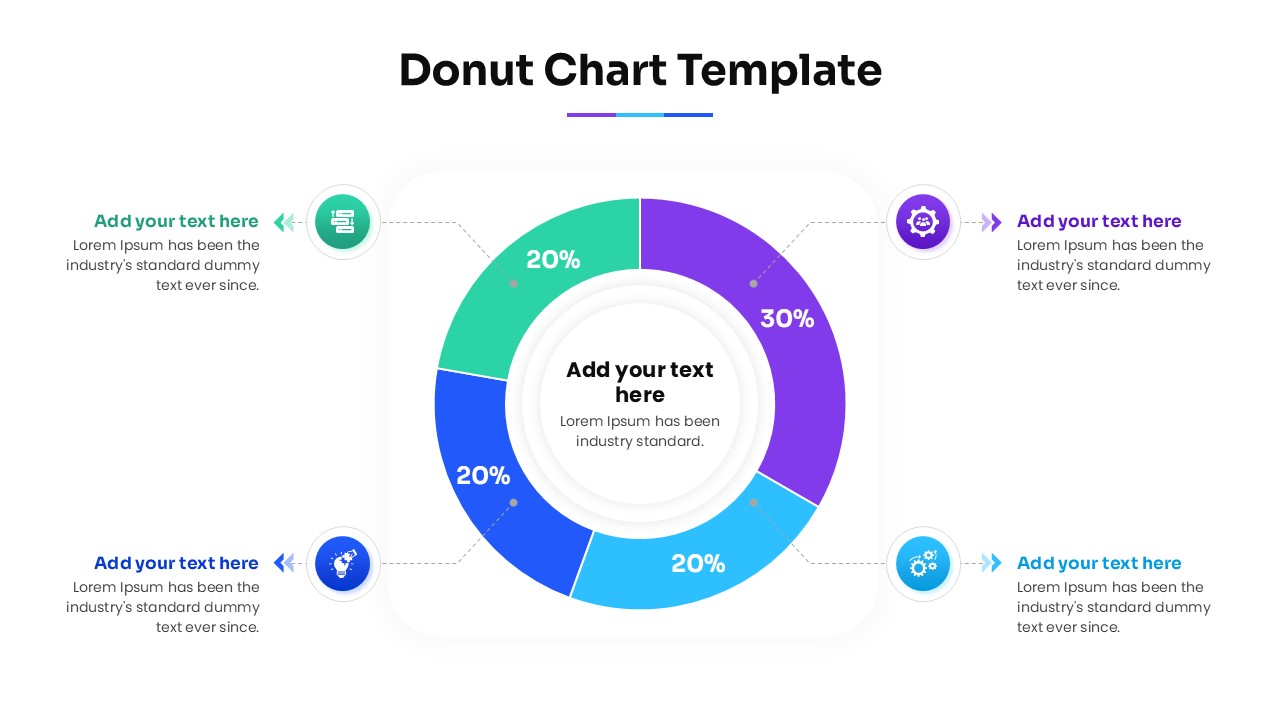
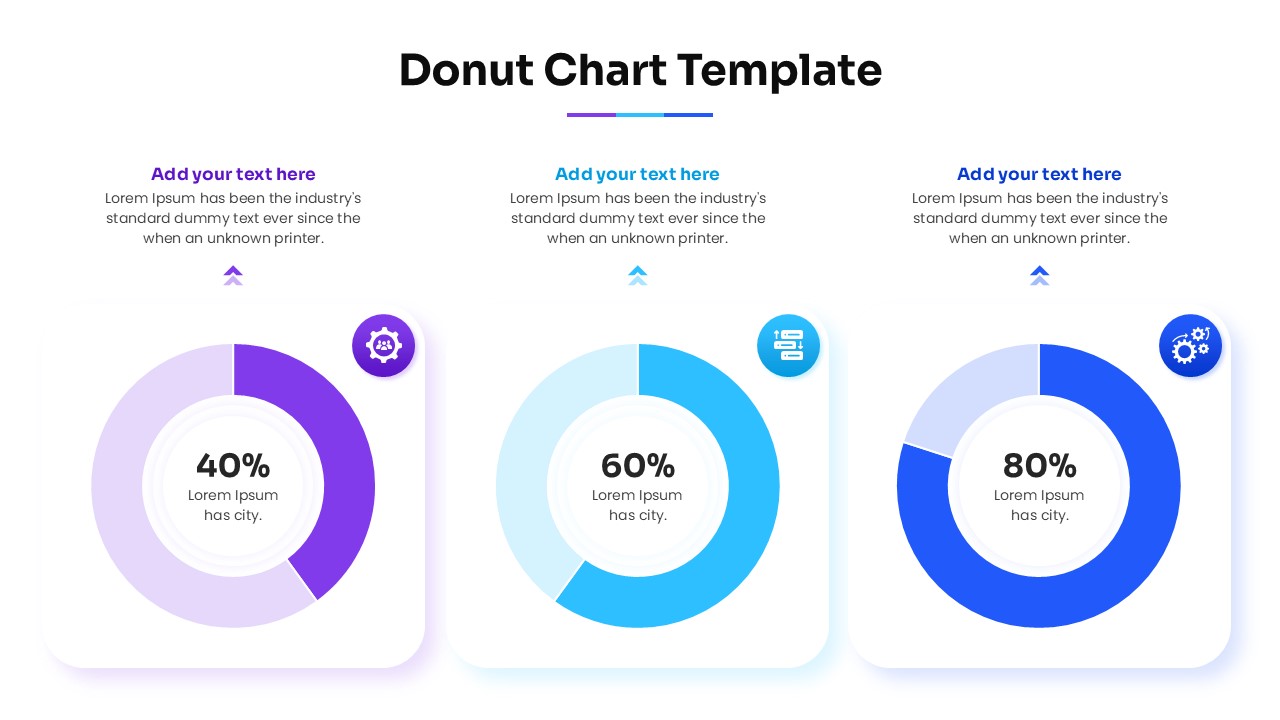
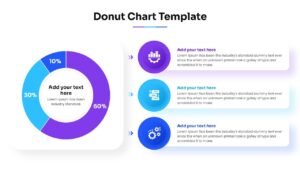
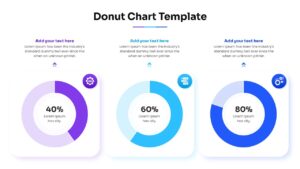
Now formatting data presentations is easier than ever to create with this aesthetically pleasing Doughnut Chart Template. These charts and graphs helps individuals to present complex statistics using easy-to-edit circular charts, percentage text boxes, data-driven segments, and modern icons.
So, whether you are planning to showcase your company’s market share or just want to make a simple budget breakdown, this Donut Chart Presentation will be perfect for you. So, release your inner designer and let your creativity soar with this amazing Donut Chart Design.
Don’t forget to checkout out our premium pie and donut chart collections for some amazing designs.
Key Features
- 100% Vector-Based Graphics
- Fully Layered & Organized
- Multi-Platform Support
- Theme Color & Theme Font
Frequently Asked Questions
- How do I change the percentages in this donut chart?
- You can easily adjust the segment sizes by selecting the shape and using the built-in data editing tools or by dragging the yellow adjustment handles on the vector shapes.
- Can I change the colors to match my company branding?
- Yes, the template uses theme colors, so you can change the entire color scheme in one click through the \"Design\" or \"Slide Master\" settings.
- Is this template compatible with Keynote?
- While designed specifically for PowerPoint and Google Slides, you can import the .pptx file into Keynote, though some minor formatting adjustments might be needed.
Related Templates
-
-
 Free
Free -
 Free
Free -
 Free
Free