Free Petal Diagram PowerPoint & Google Slides Template
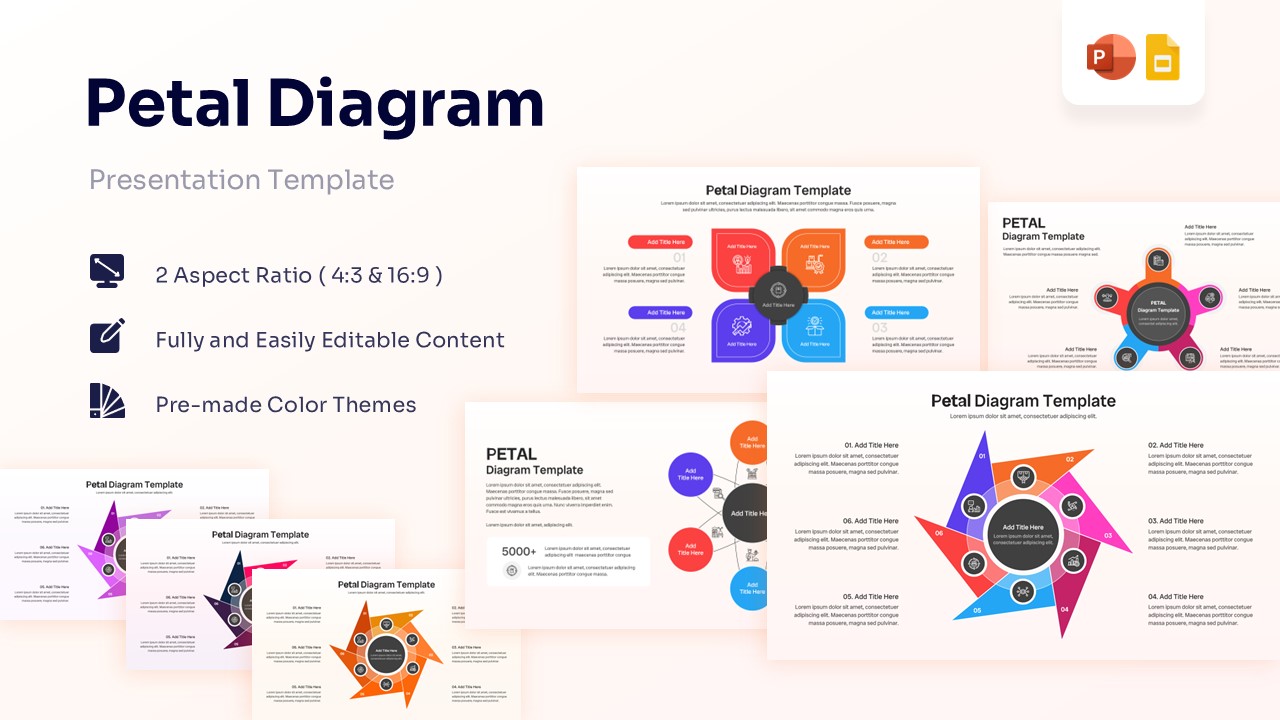


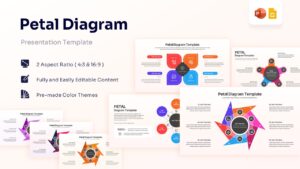
Editable Petal Diagram Template for Process Visualization
Presenting ideas in a clear and visually engaging way can make complex information easier to understand. Whether you’re explaining a process, showcasing key business components, or mapping relationships between concepts, this well-designed free petal diagram can make all the difference. If you’re looking for inspiration, explore our editable business process infographic slides to create more impactful presentations.
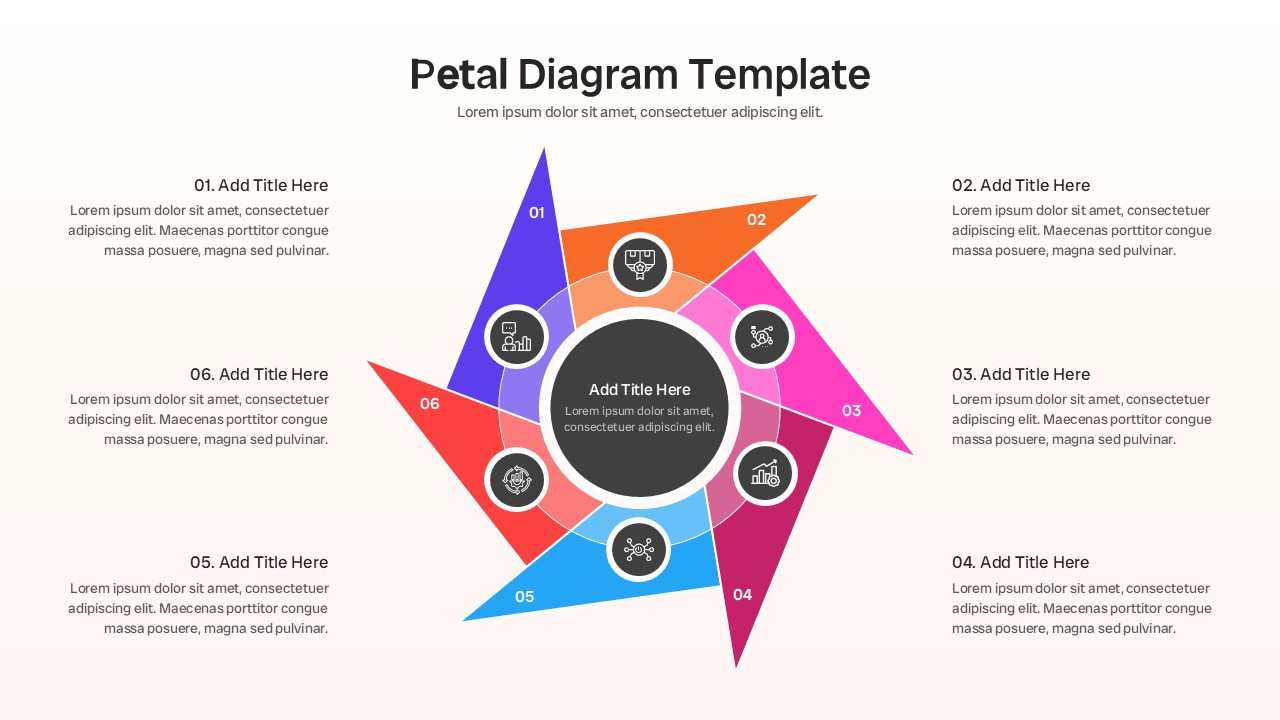
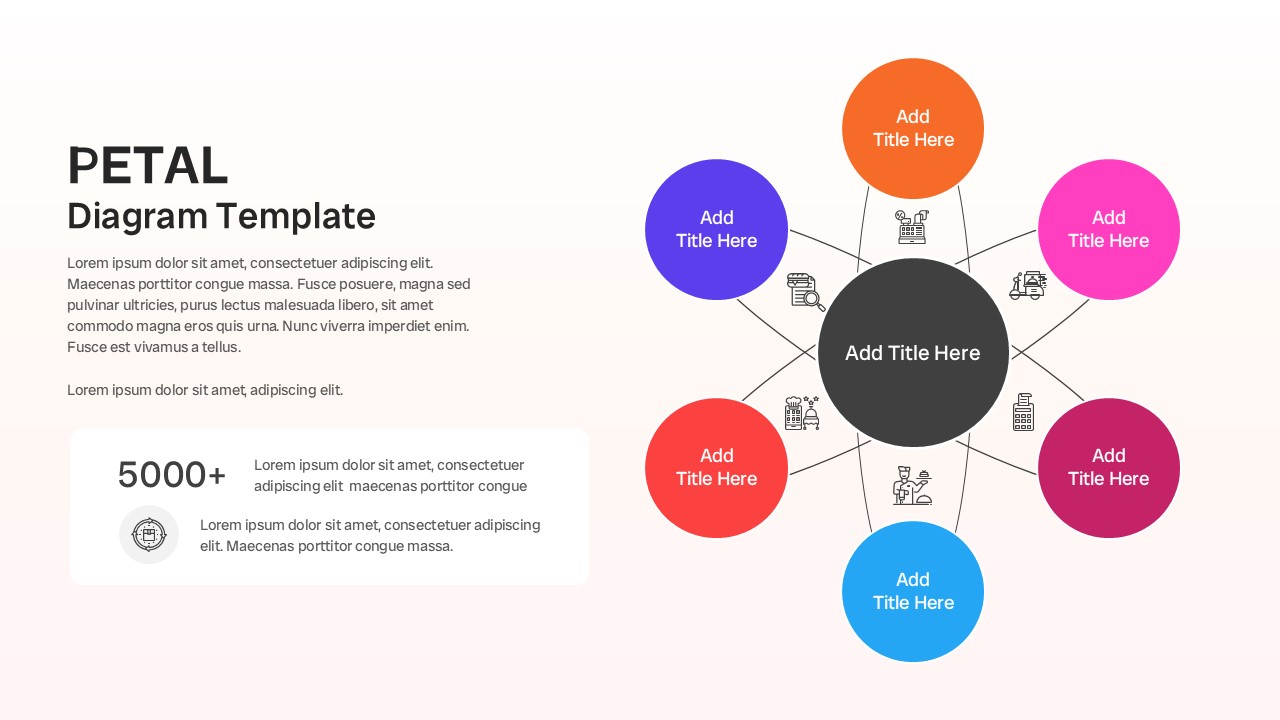
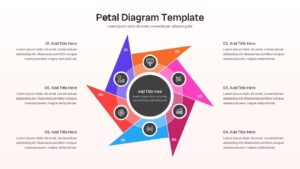
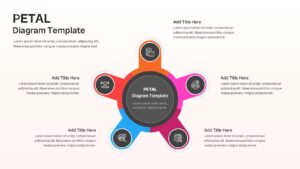
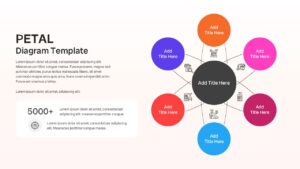
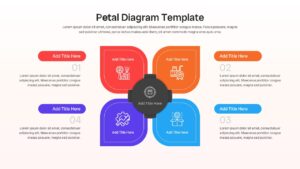
Now visualizing interconnected concepts is easier than ever to create with this aesthetically pleasing Petal Diagram Template. This Petal Diagram PowerPoint helps individuals to present ideas, explain workflows, highlight business stages, and showcase relationships using easy-to-edit petal diagrams, circular layouts, infographic icons, numbered sections, and process visualization graphics.
So, whether you are planning to explain a strategic framework or just want to make a business process presentation, this Petal Infographic Diagram will be perfect for you. So, release your inner designer and let your creativity soar with this amazing 6 Step Petal Diagram.
Don’t forget to checkout out our creative process infographic presentation templates for some amazing designs.
Key Features
- 100% Vector-Based Graphics
- Fully Layered & Organized
- Multi-Platform Support
- Theme Color & Theme Font
- Multiple Petal Diagram Layout Variations
- Editable Icons, Shapes & Process Elements
Frequently Asked Questions
- What is a Petal Diagram Template used for?
- A Petal Diagram Template is commonly used to present interconnected ideas, business strategies, workflows, processes, features, and organizational concepts in a visually appealing format.
- Can I edit the Petal Diagram PowerPoint slides?
- Yes. All shapes, colors, text placeholders, icons, and infographic elements are fully editable in both PowerPoint and Google Slides.
- Who can use a Circular Petal Process Diagram?
- Business professionals, consultants, marketers, educators, project managers, and students can use these diagrams to simplify complex information and improve audience understanding.
Related Templates
-
 Free
Free -
-
 Free
Free -