Quadruple Venn Diagram Template for PowerPoint & Google Slides


Streamline Complex Data Overlaps Venn Diagram
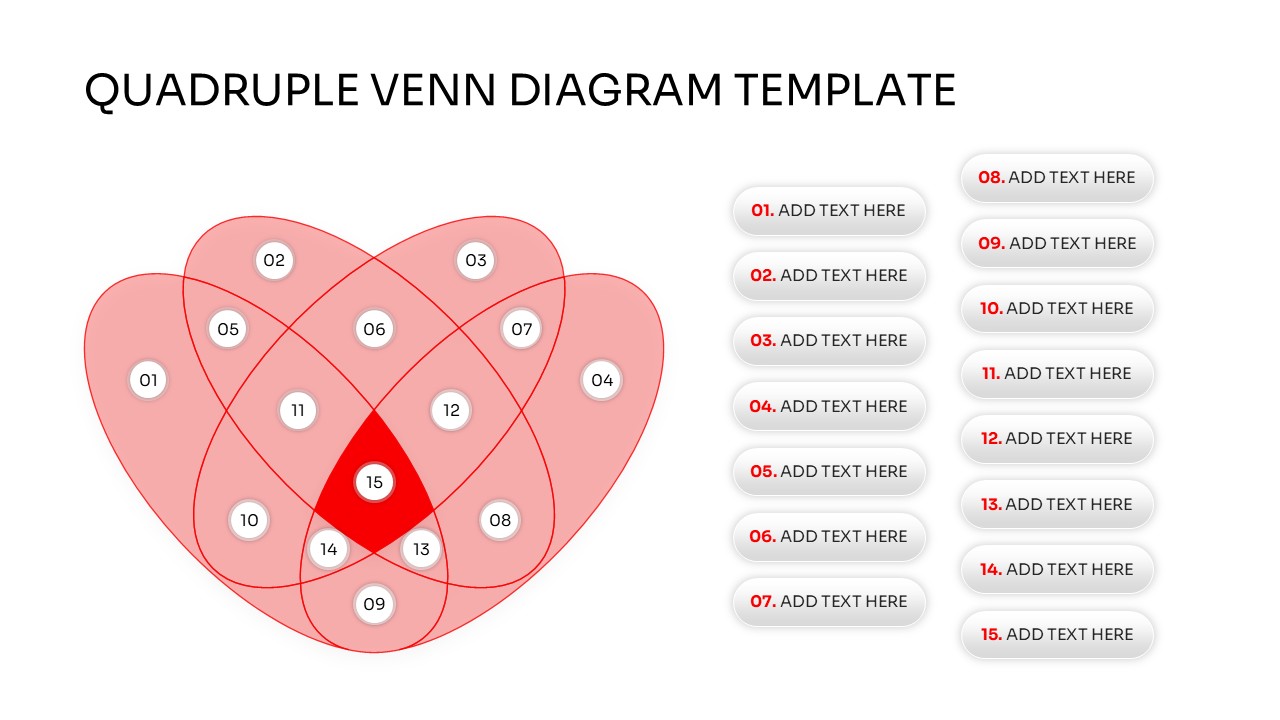
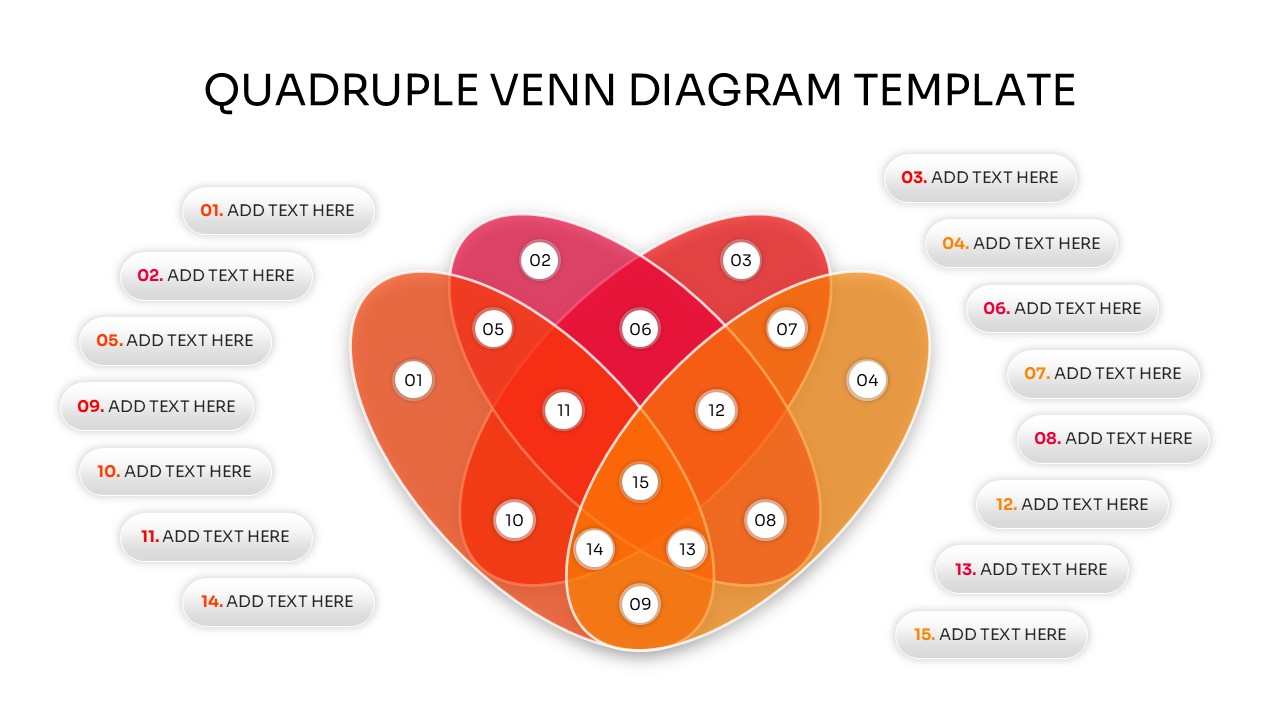
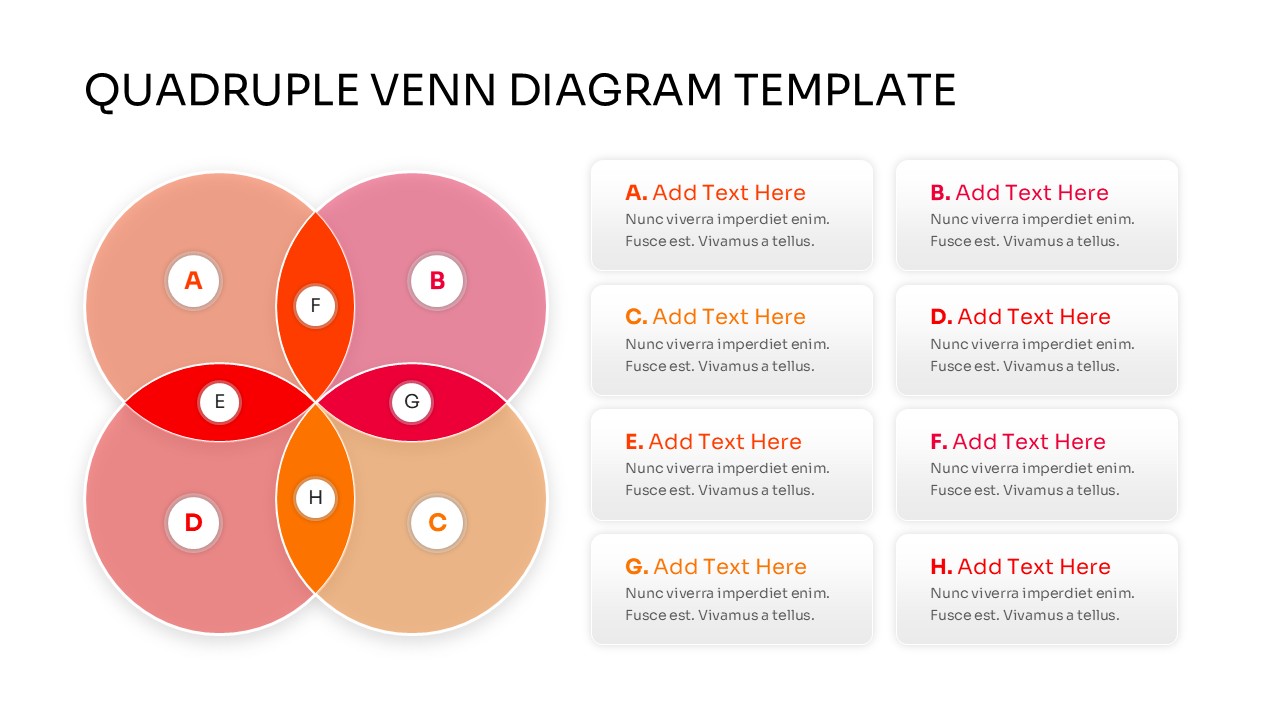
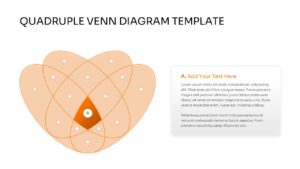
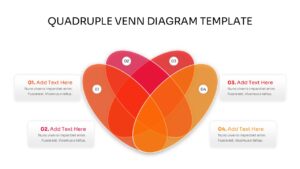
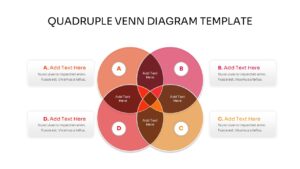
Representing multi-layered relationships among different datasets often poses a significant cognitive challenge for an audience, making a dedicated Quadruple Venn Diagram Template an essential tool for clarity. In strategic planning, data science, and market segmentation, professionals frequently need to isolate shared elements across exactly four distinct parameters without overcomplicating the narrative. Managing these intricate intersections requires clean, geometrically precise layouts that instantly communicate logic. Utilizing standard list structures fails to capture these intersections effectively, leading to analytical gaps or lost audience attention.
Download our Quadruple Venn Diagram Template for PowerPoint and Google Slides to transform abstract data relationships into highly accessible, visual narratives. The contemporary design aesthetics, balanced geometric shapes, and custom placeholder boxes ensure your presentation keeps technical and corporate audiences fully locked into your findings. You can seamlessly customize these overlapping circle slides to fit your corporate brand identity, giving you a polished deck that avoids typical text-heavy visual fatigue.
Key Features
- 100% Vector-Based Graphics
- Fully Layered & Organized
- Multi-Platform Support
- Theme Color & Theme Font
- 2 Aspect Ratios (4:3 & 16:9)
- Easily Editable Shapes and Colors
Frequently Asked Questions
- Can I change the colors of individual intersections?
- Yes, every segment is a separate vector shape, allowing you to change colors to match your branding.
- Is this template compatible with Keynote?
- While designed for PowerPoint and Google Slides, the PPTX file can be imported into Keynote with high compatibility.
- How do I add more text to the circles?
- You can easily insert new text boxes or use the provided side-panel placeholders for detailed descriptions.
Related Templates
-
-
 $4.99
$4.99 -
 $3.99
$3.99 -
 $3.99
$3.99