Free Comparison Chart Template for PowerPoint & Google Slides
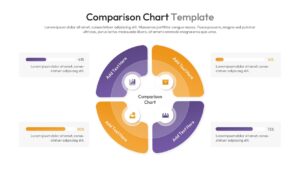
Professional Product Comparison Presentation Template
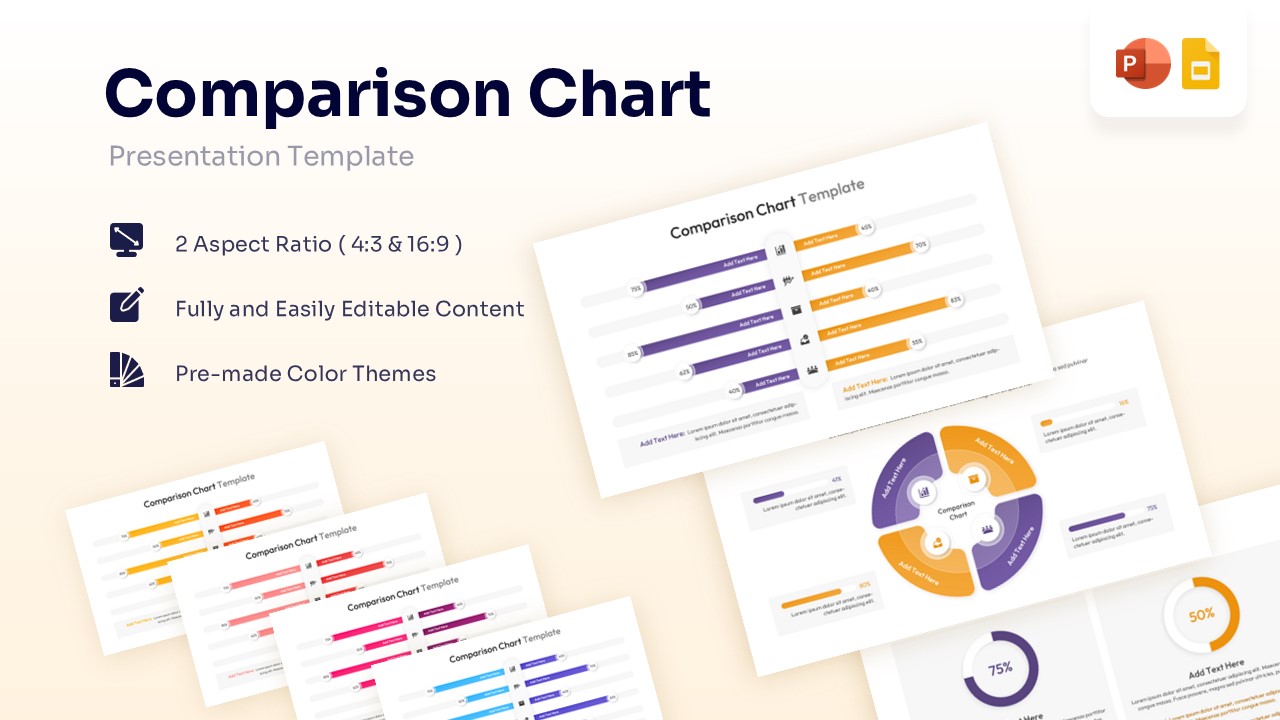
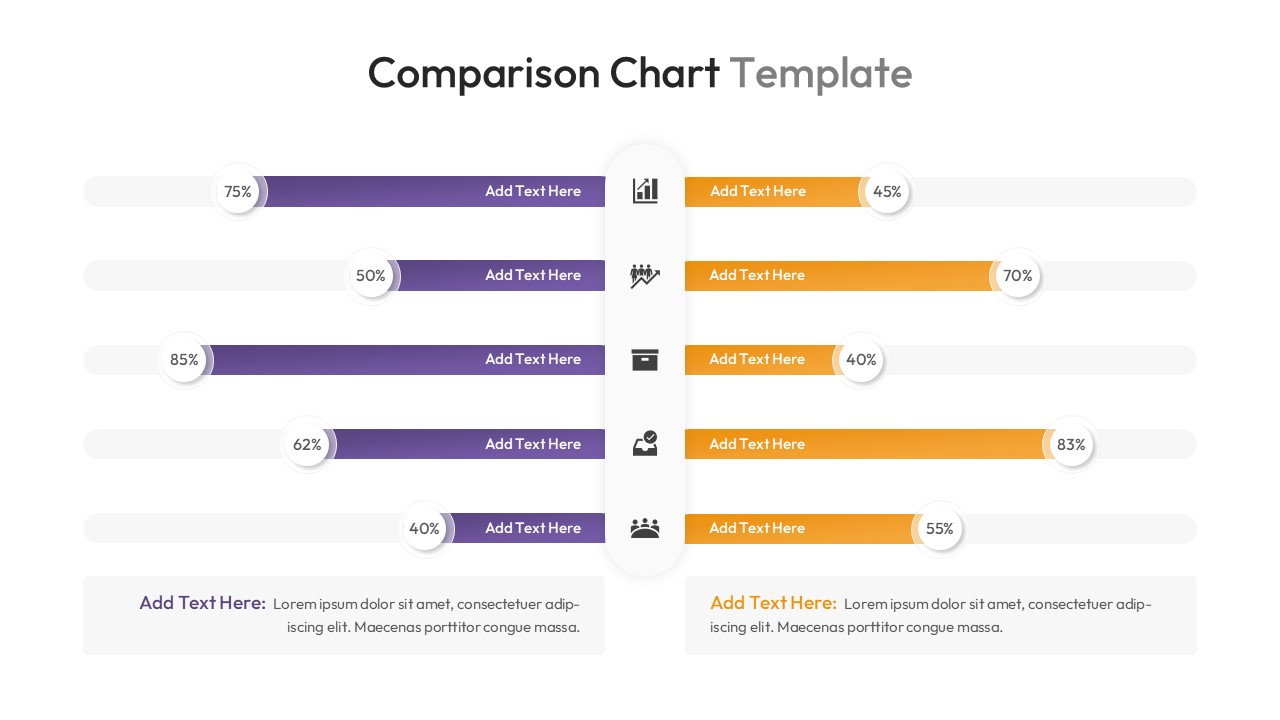
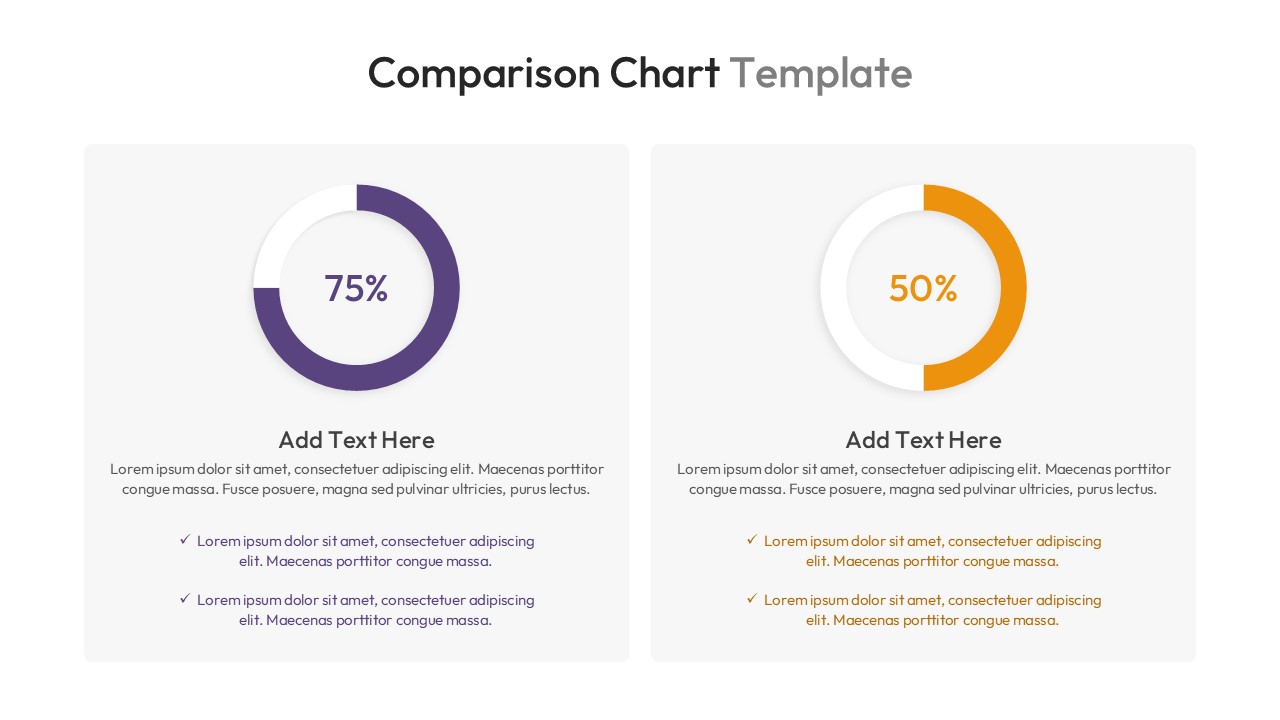
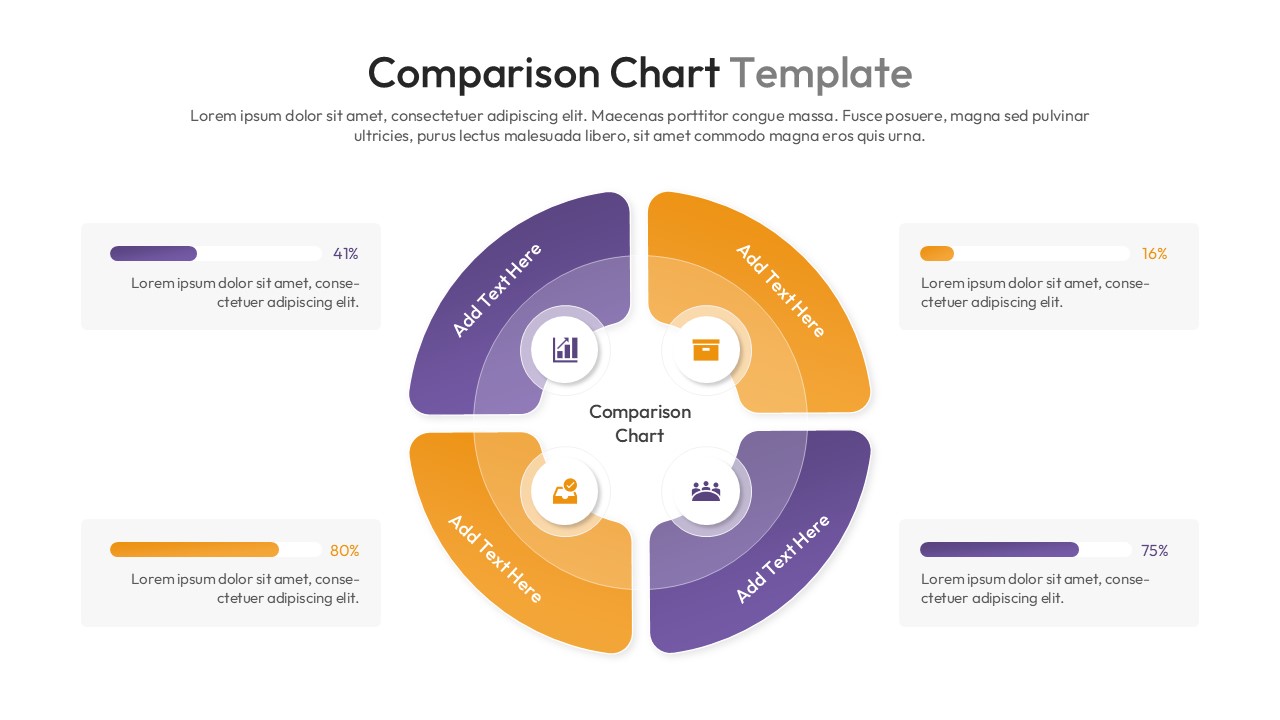
Unlock the ability to clearly contrast your data and ideas by downloading this Free Comparison Chart Template for PowerPoint and Google Slides to discover the absolute impact of structured visual analysis. Whether you are weighing multiple options or evaluating performance, this comparison infographic chart gives you the power to showcase complex content much more visually, making it significantly easier for your audience to understand the bottom line. Best of all, PresentoVerse layouts like this set are very simple to use, You just need to download the file, select your favorite graphical elements, edit the numbers or text to reflect your findings, and paste them directly into your ongoing presentation. Move towards absolute clarity and confident decision-making thanks to these beautifully crafted comparison layouts!
Key Features
- 100% editable and easy to modify
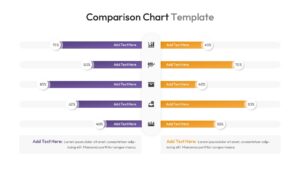
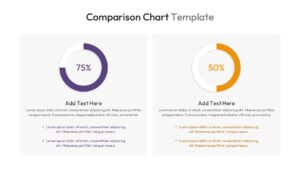
- Different Pros and Cons Chart layouts to boost your presentations
- Includes vector icons and extensions for further customization
- Designed to be used in Google Slides and Microsoft PowerPoint
- Includes information about how to edit and customize your layout
Frequently Asked Questions
- Can I change the data percentages easily?
- Yes, all shapes and text boxes are fully editable. You can adjust the length of the bars and the text numbers to match your specific data.
- Is this template compatible with Google Slides?
- Yes, this template works perfectly with both Microsoft PowerPoint and Google Slides.
- Can I replace the icons?
- Absolutely. The icons are vector-based, meaning you can swap them out, resize them, or recolor them without losing quality.
Related Templates
-
Free Blank Bar Chart Template for PowerPoint & Google Slides
Bar and Column
Free -
 Free
Free -
Harvey Balls Diagram Presentation Template
Charts & Graphs
Free -