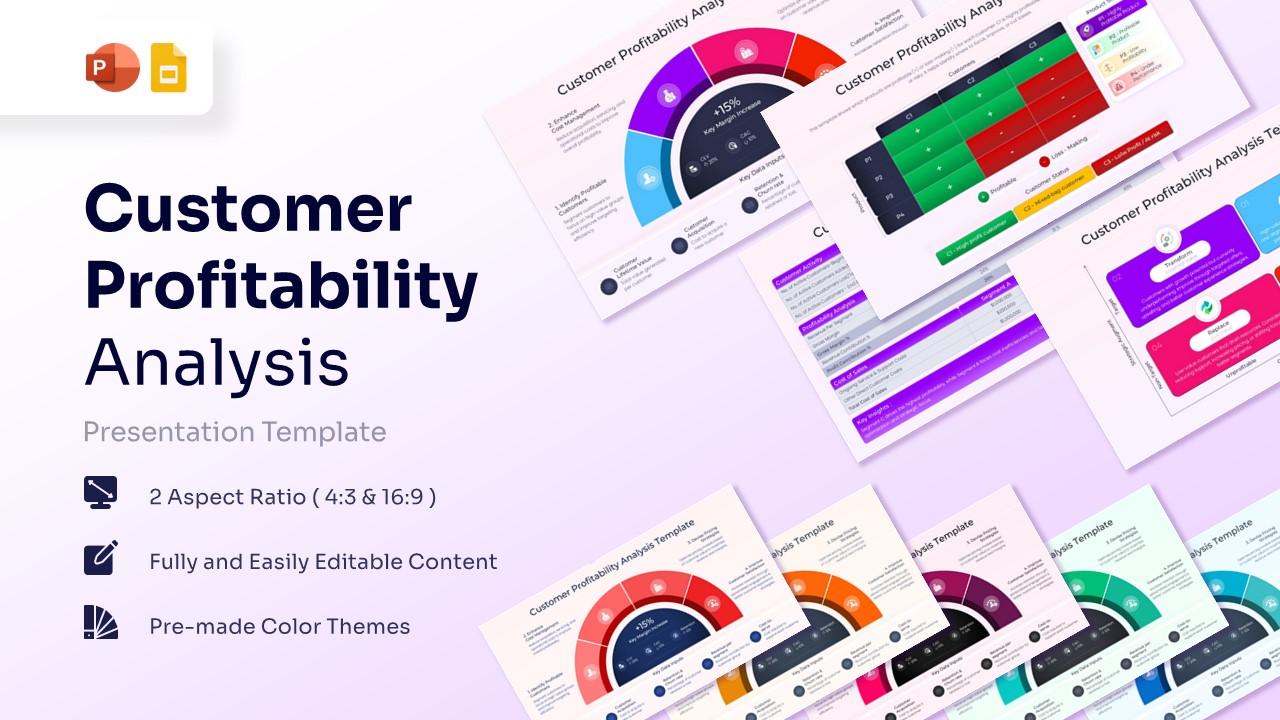
Free Waterfall Chart Template for PowerPoint & Google Slides
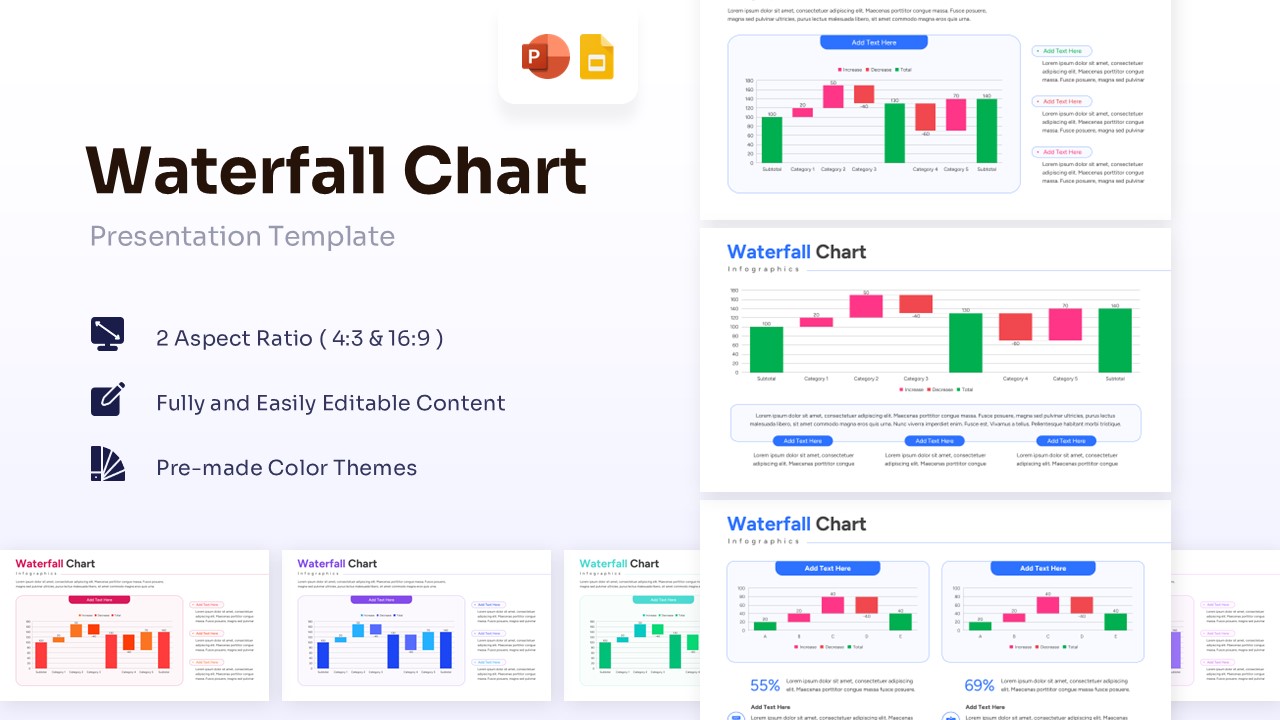

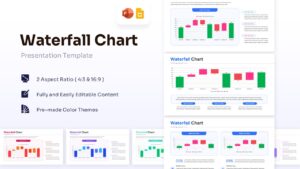
Visualizing Financial Progress with Waterfall Diagram Slide
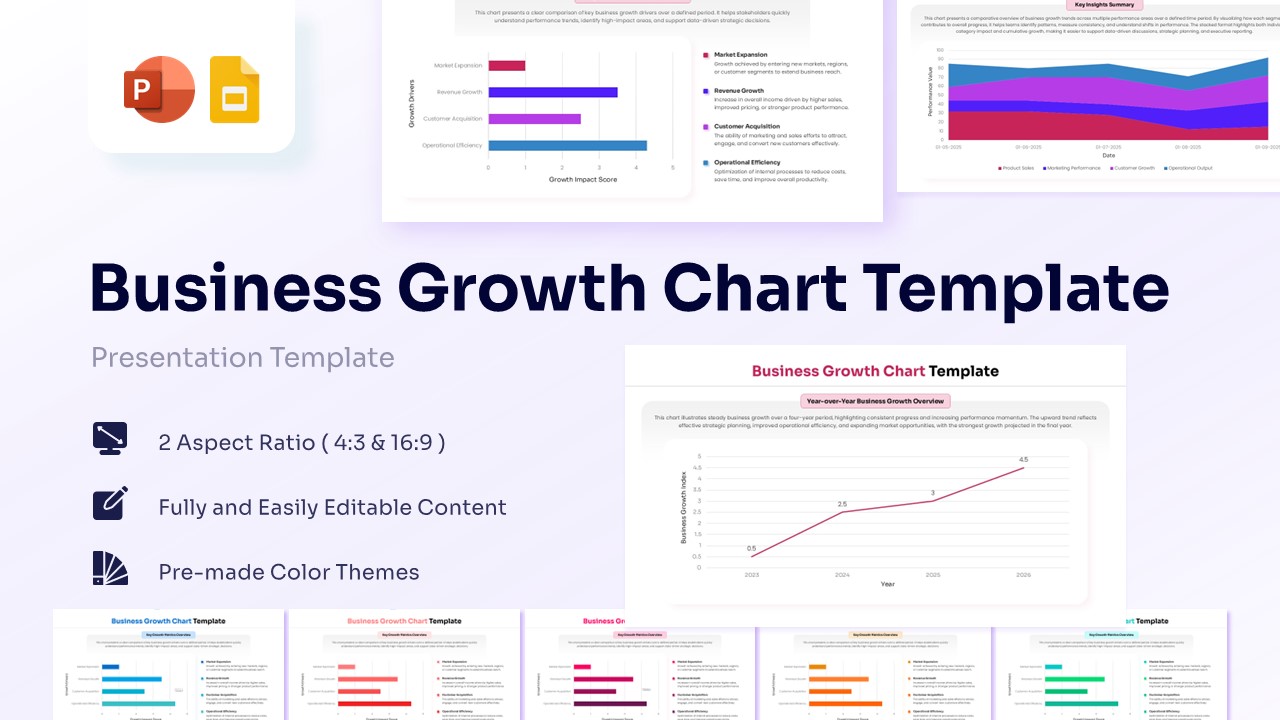
Get this Waterfall Chart Template, a bar chart template created to illustrate sequential financial increments using floating column blocks. This bar and column chart template visually maps initial values, positive adjustments, and negative reductions in a connected format. It includes labelled sections for category metrics, subtotal markers, and value changes. The chart diagram clearly shows how these components move through an analytical breakdown to produce final net totals. The design supports corporate budget reviews, earnings calls, and stakeholder audit evaluations. Color-coded incremental bars and data connectors help present system relationships in a clear sequence. The slide keeps technical information organized without overcrowding the layout. This template is fully compatible with PowerPoint and Google Slides for premium data visualization slides corporate finance and strategic planning presentations.
What Is This Waterfall Chart Template?
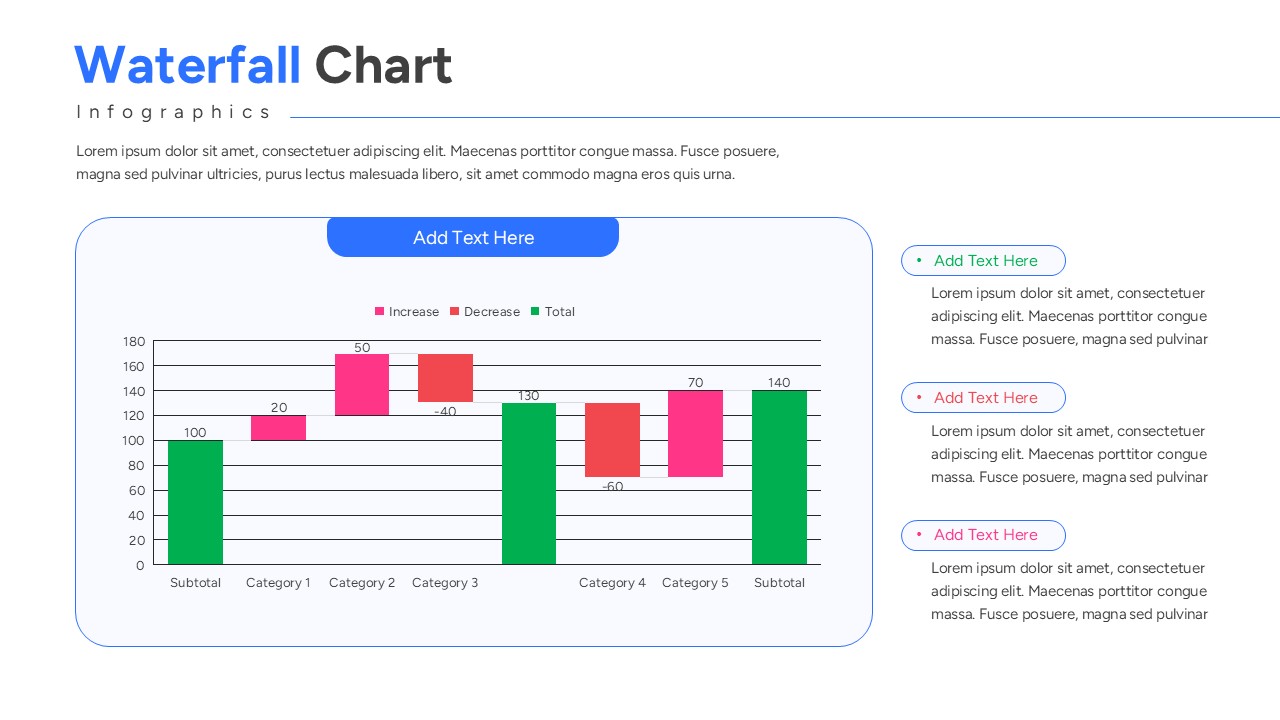
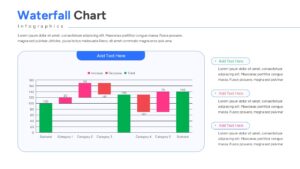
This Free Waterfall Diagram is a ready-made slide built to present net variance development in a visual format. It organizes key components such as revenue gains, cost deductions, and operational expenses into a logical flow. The template highlights how these inputs move into the cumulative total margin calculation. It visually represents strategic fiscal changes through clear profit and loss visual summaries. The layout helps teams explain architecture in a structured way. It serves as a business presentation template for corporate finance and quantitative reporting.
When to Use This Template
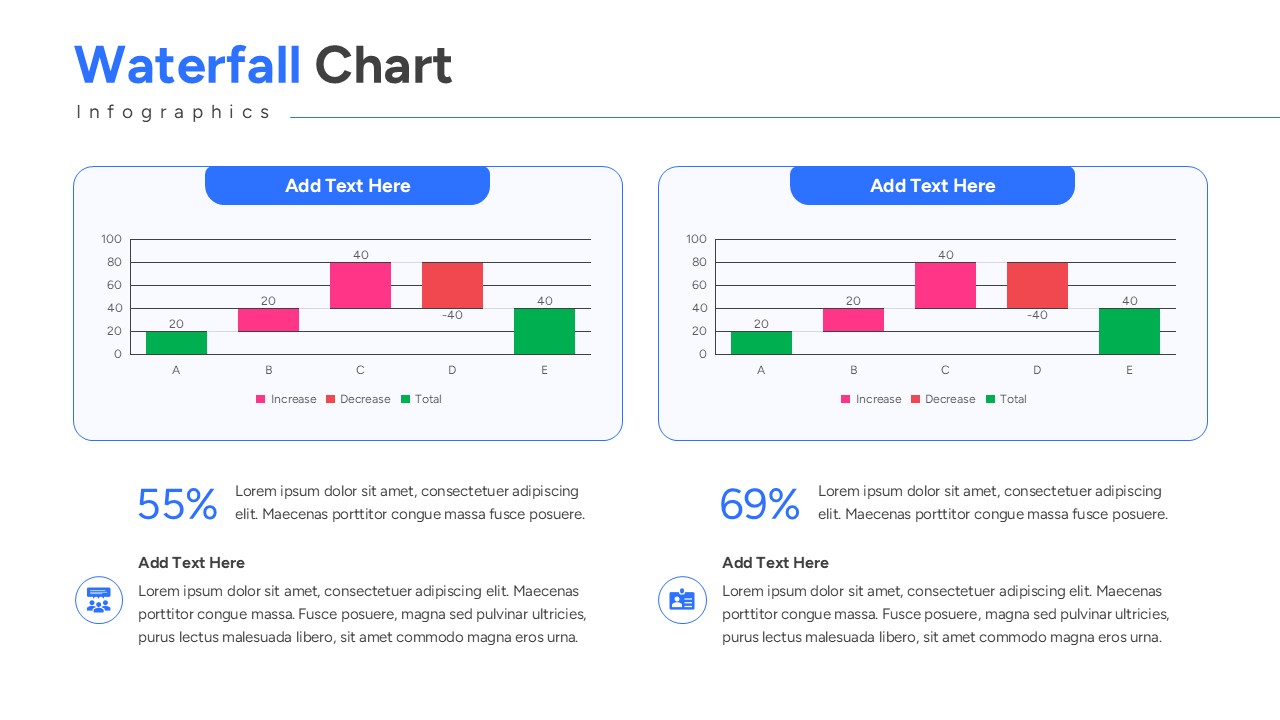
Use this template when presenting quarterly earnings variance, project cost escalations, or budget vs. actual performance deviations. It is suitable for executive board meetings, financial performance reviews, and investor pitch updates. The layout supports clear explanation of professional bar and column charts net income walk progressions to both technical and business audiences.
Customization and Editing Options
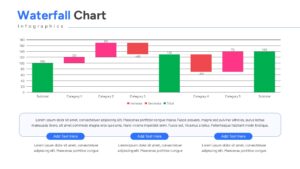
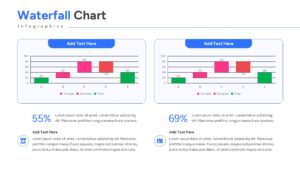
Users can edit all labels, headings, and descriptions in PowerPoint or Google Slides. Colors can be updated to match corporate branding. Diagram shapes and elements can be resized or repositioned to fit additional details. The increase, decrease, and subtotal bar colors can be adjusted to reflect organization-specific terminology. Additional slides can be duplicated to expand the explanation.
PowerPoint and Google Slides Compatibility
This free waterfall model diagram works smoothly in Microsoft PowerPoint and Google Slides. The structure remains consistent across both platforms. It supports in-person technical reviews, virtual briefings, and internal presentations.
Key Features
- 100% Vector-Based Graphics
- Fully Layered & Organized
- Multi-Platform Support
- Theme Color & Theme Font
Frequently Asked Questions
- Can I change the colors for positive and negative values?
- Yes, the bars are fully editable shapes; you can easily apply your brand colors for increases and decreases.
- Does this work with my existing deck?
- Absolutely. These slides are designed to be copied and pasted into any existing presentation while maintaining theme consistency.
- Is there a limit to how many categories I can add?
- The layout is flexible, allowing you to add or remove bars to match the number of data steps in your specific analysis.
Related Templates
-
 Free
Free -
 Free
Free -
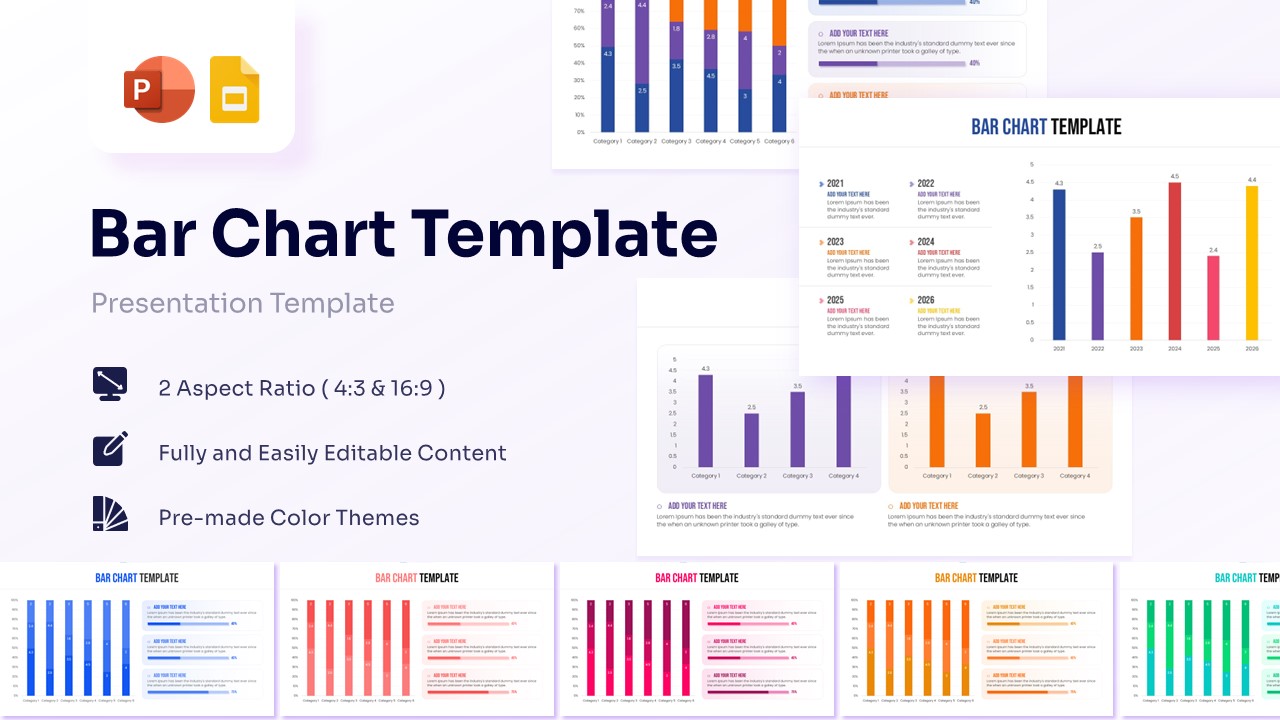
Free Blank Bar Chart Template for PowerPoint & Google Slides
Bar and Column
Free -