Pros and Cons Comparison Chart Free Template for PowerPoint & Google Slides


Advantages and Disadvantages Comparison Chart Presentation Template
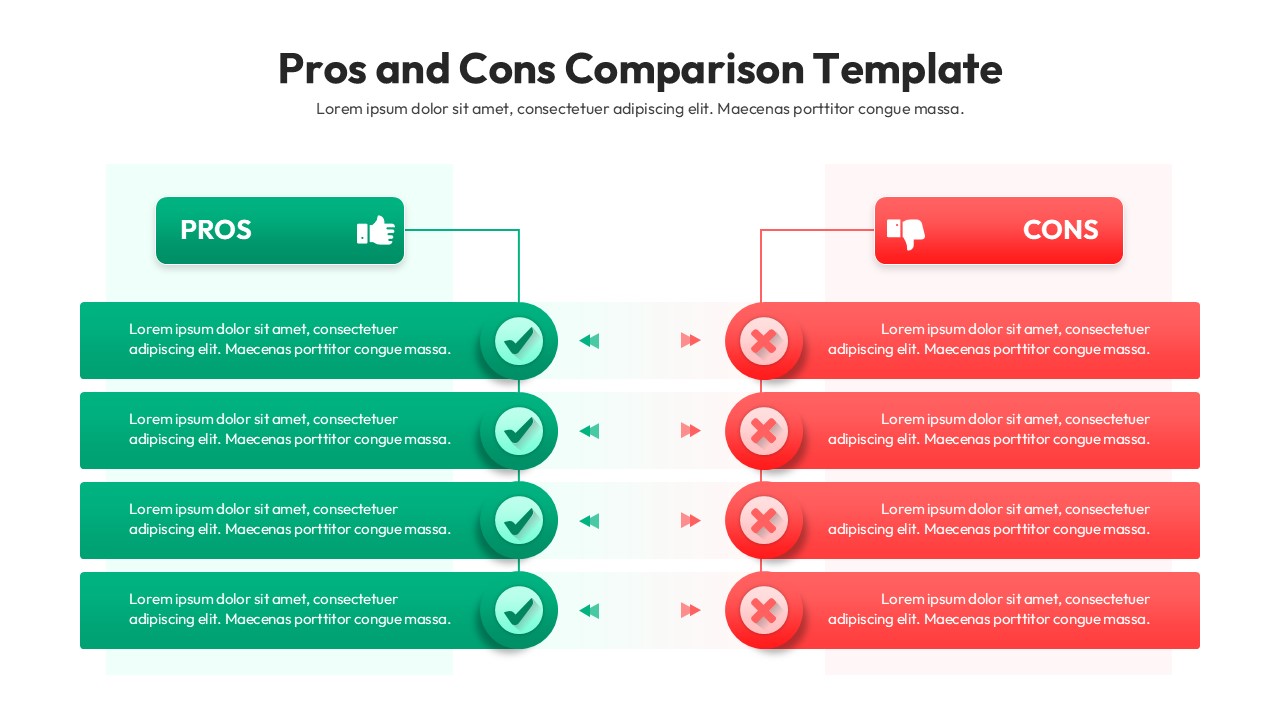
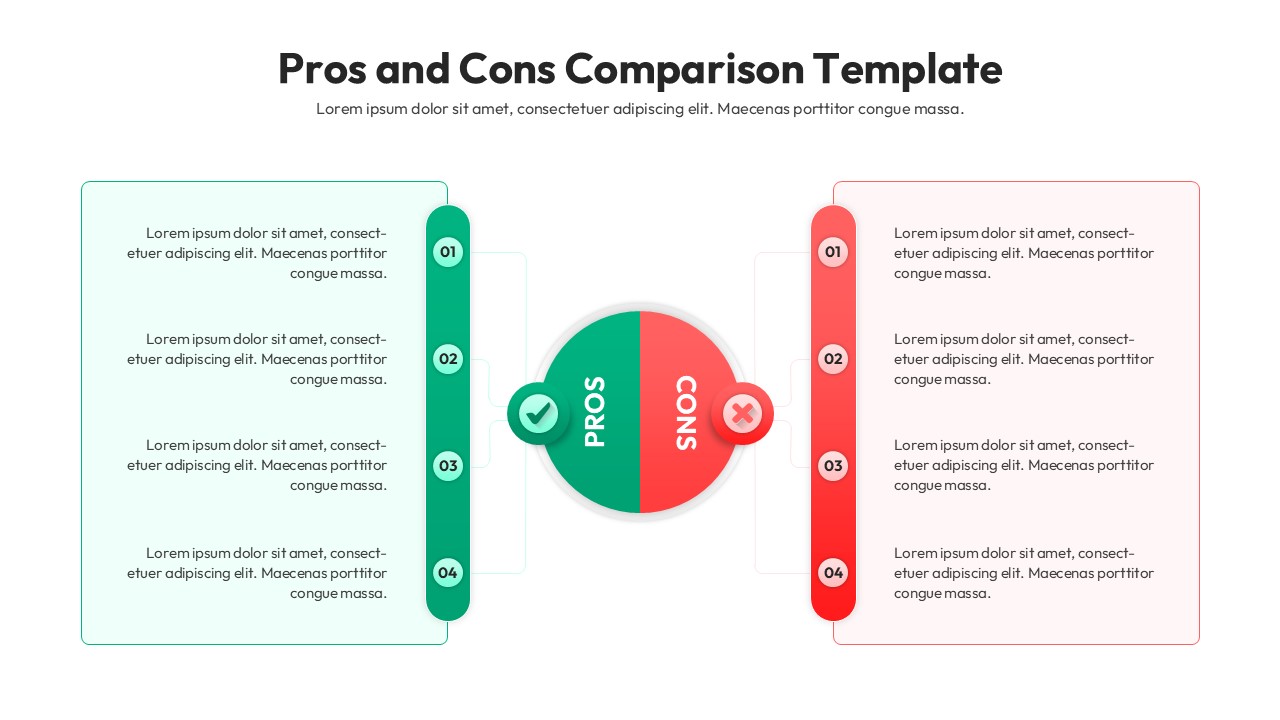
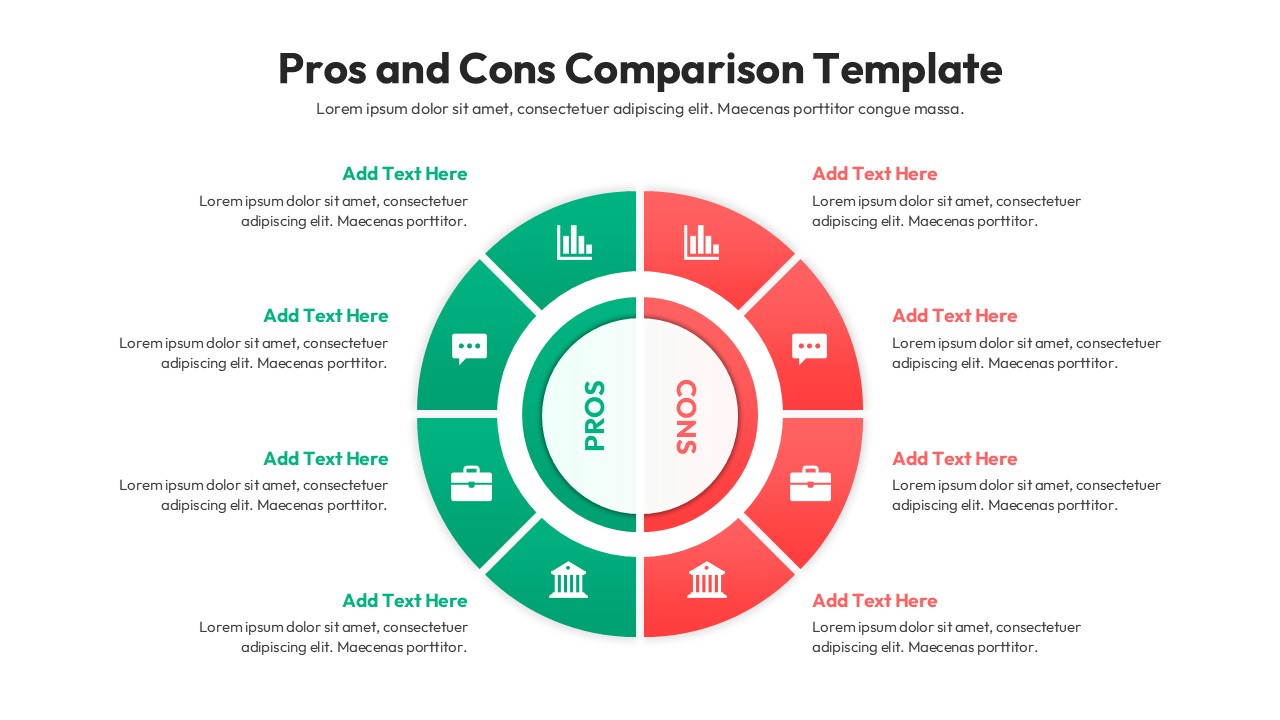
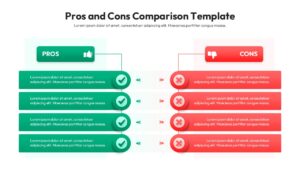
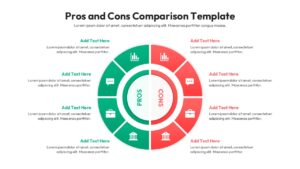
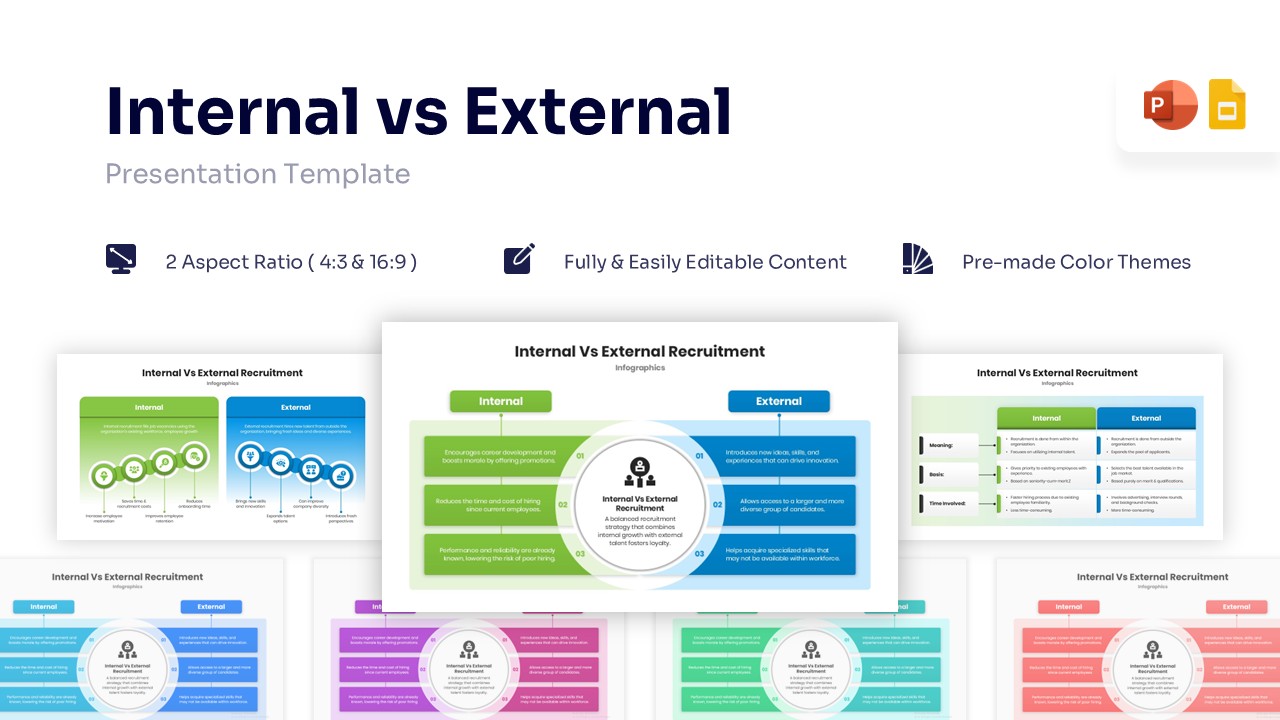
This Free Pros and Cons Comparison Chart Template is a sophisticated visual framework designed to help presenters evaluate opposing viewpoints through a structured and professional lens. This comparison infographic slide features a variety of layouts, including central hub diagrams, side-by-side lists, and circular comparative models, all built as fully customizable PowerPoint objects that adapt seamlessly to your brand’s aesthetic. Each element is meticulously crafted to illustrate positive and negative factors during business decision-making sessions, allowing you to highlight critical trade-offs with clarity using distinct color-coded indicators like green checkmarks and red cross icons.
These versatile pros and cons charts are available in multiple theme colors and support both light and dark background modes, ensuring maximum legibility across different viewing environments. To provide a more comprehensive overview of your project’s landscape, we suggest complementing the slide with other specific comparison infographics such as SWOT analysis or matrix grids. Create appealing Pros and Cons Comparison presentations that engage global audiences with our top of the line Presentation Templates to make professional PowerPoint designs. Also try checking our Free Infographics Template library.
Who Should Download this Cons and Pros Comparison Diagram
- Project managers and team leaders evaluating new initiatives.
- Business analysts and consultants presenting recommendations.
- Product managers comparing features or market strategies.
- Educators and students analyzing different concepts or theories.
Key Features
- 100% Vector-Based Graphics
- Fully Layered & Organized
- Multi-Platform Support
- Theme Color & Theme Font
- 2 Aspect Ratios (4:3 & 16:9)
Frequently Asked Questions
- Can I change the colors to match my brand?
- Yes, the template uses theme colors, so it automatically adapts to your brand palette.
- Does this work in Google Slides and PowerPoint?
- Absolutely, this template is fully optimized for both PowerPoint and Google Slides.
Related Templates
-
-
-
-
 Free
Free