
Harvey Balls Diagram Presentation Template
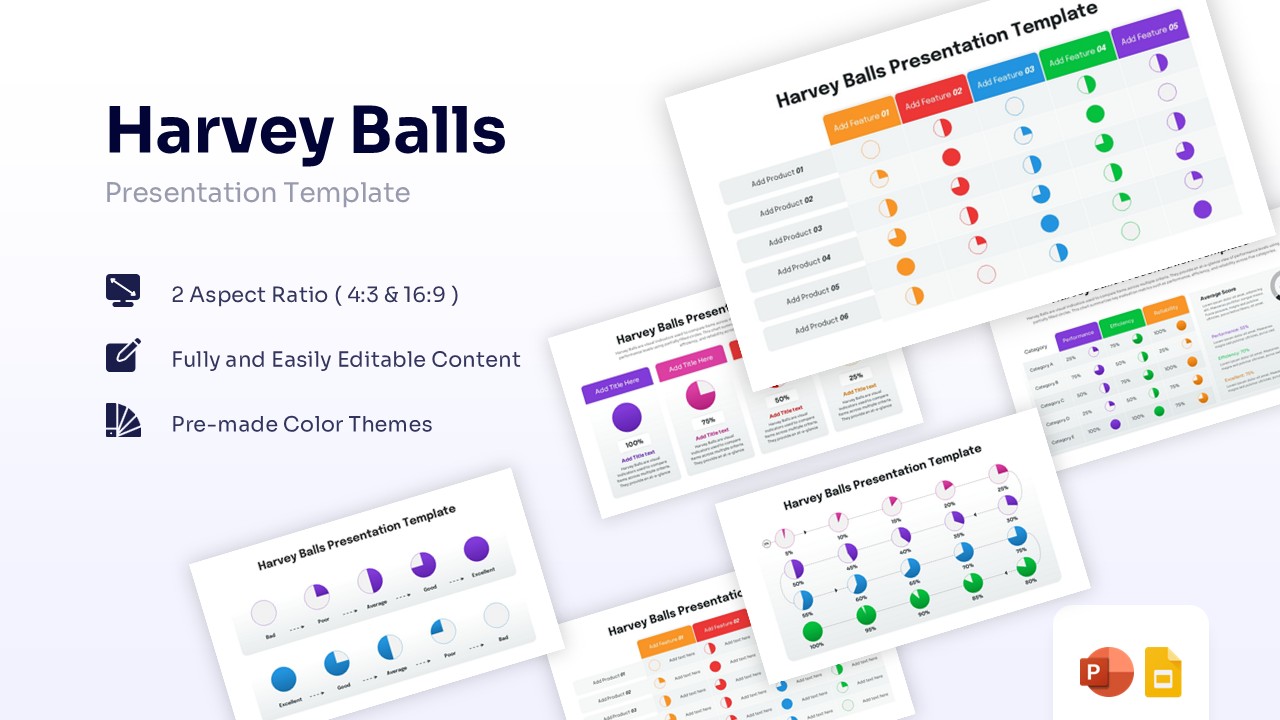
Free Harvey Balls Chart for PowerPoint and Google Slides
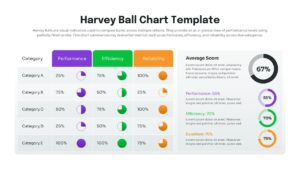
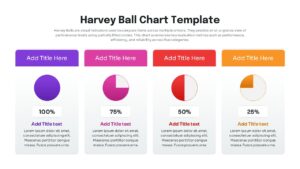
Being able to visually communicate progress and status is the key to successful project management. Presenting complex comparative data requires clear visual indicators, which you can easily achieve by using this professional free Harvey balls diagram template.
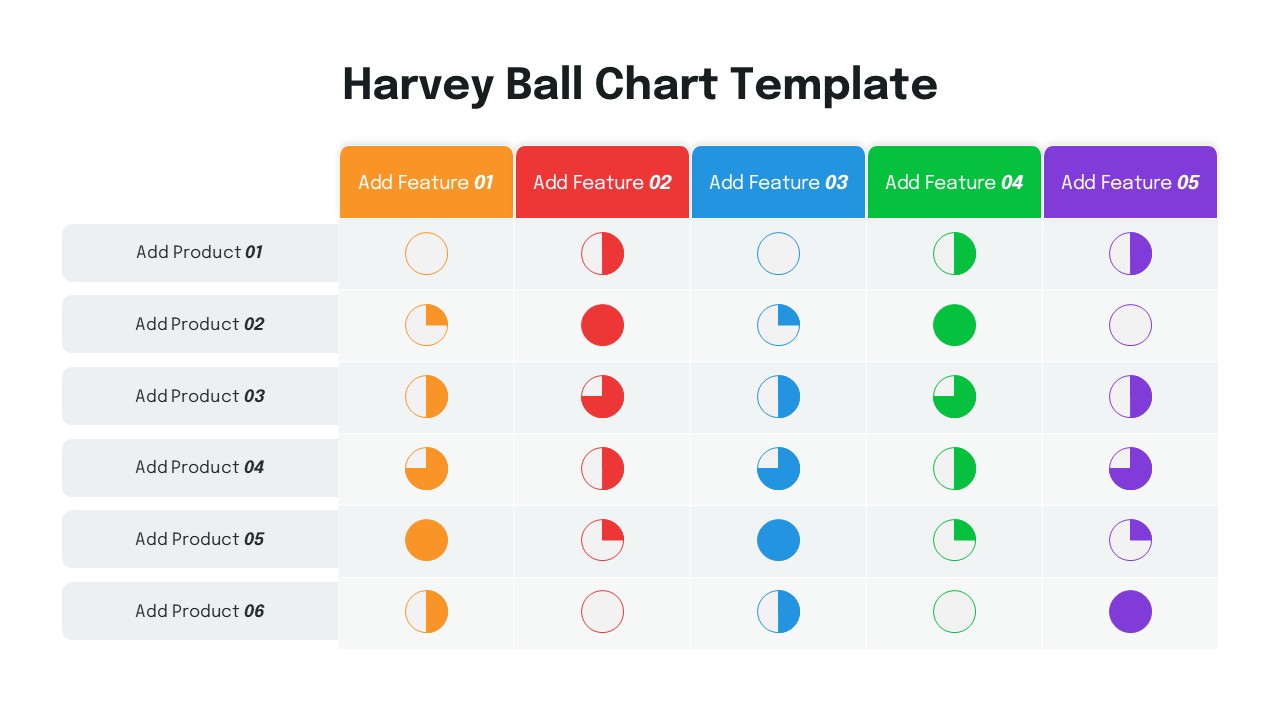
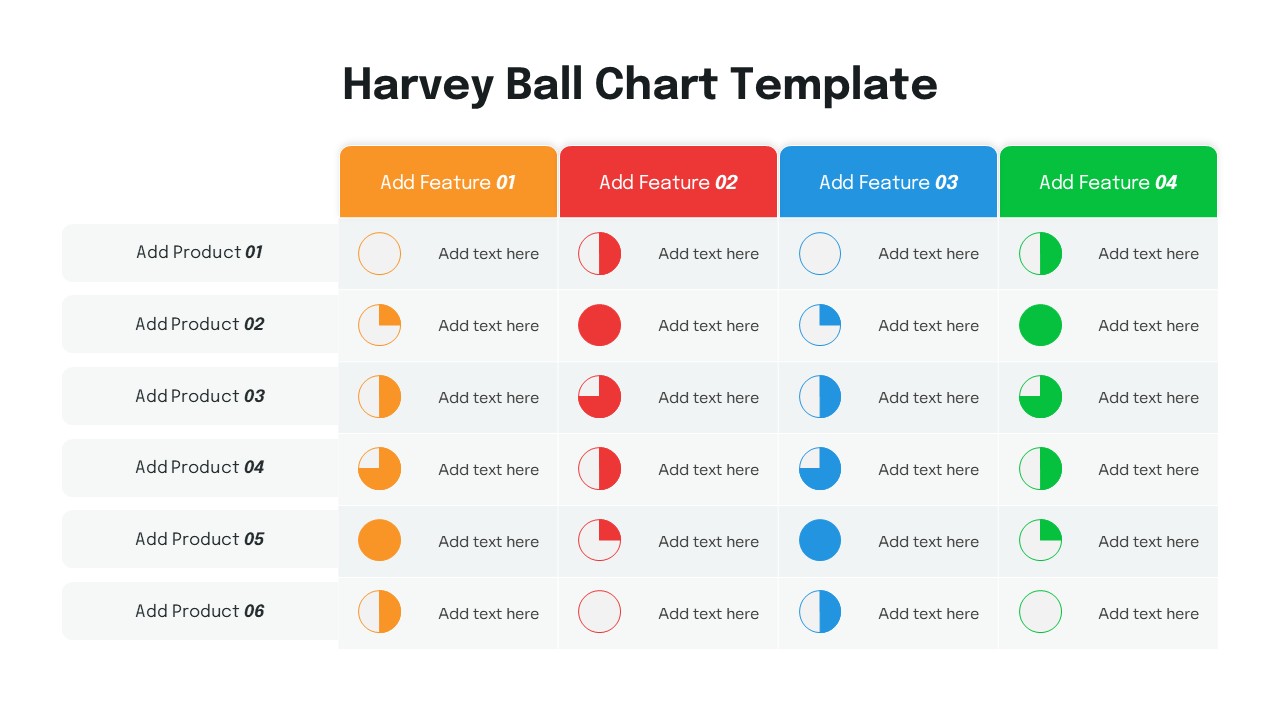
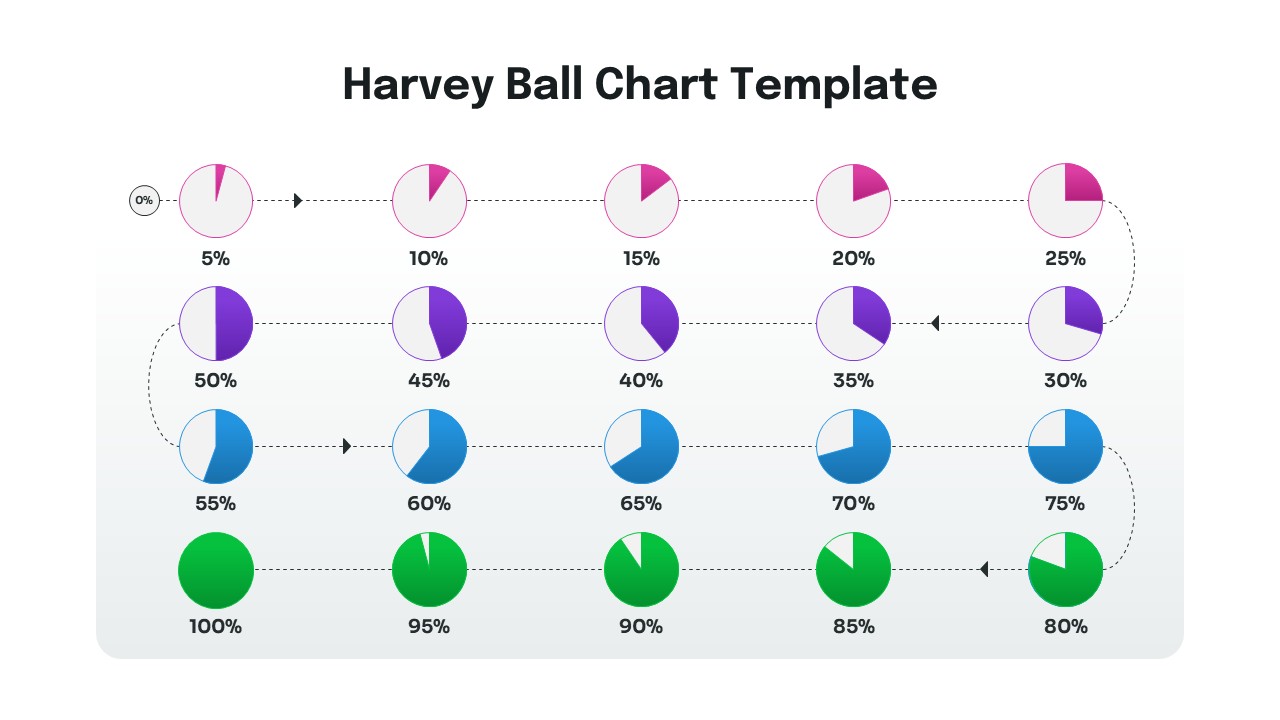
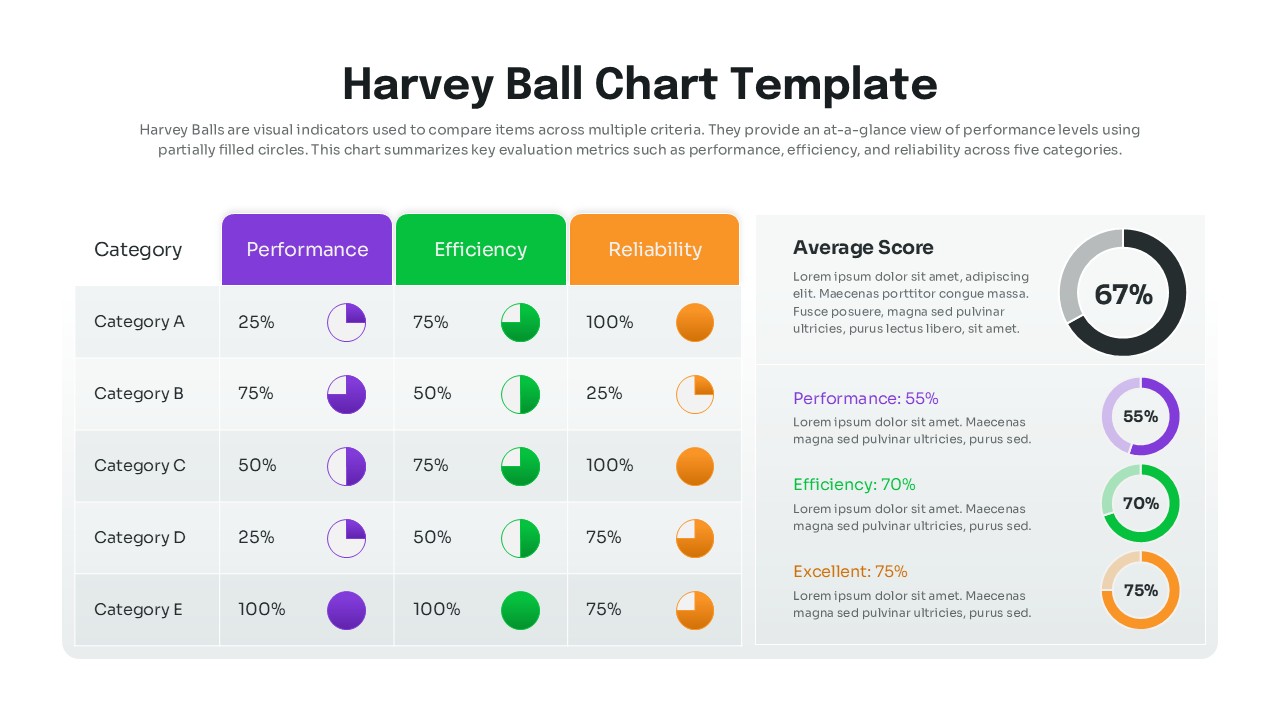
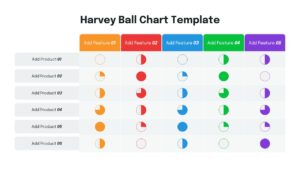
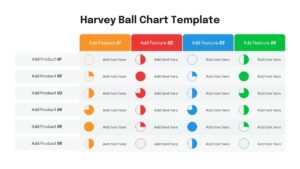
Now tracking project metrics is easier than ever to create with this aesthetically pleasing Harvey Balls Diagram. This Harvey balls chart helps individuals to compare product features using easy-to-edit status matrices, percentage indicators, rating scales, and comparison tables.
So, whether you are planning to evaluate software features or just want to make a project status report, this statistical infographic template will be perfect for you. So, release your inner designer and let your creativity soar with this amazing visual tracking slide.
Don’t forget to checkout out our free data visualization layouts for some amazing designs.
Key Features
- 100% Vector-Based Graphics
- Fully Layered & Organized
- Multi-Platform Support
- Theme Color & Theme Font
- Includes 2 Aspect Ratios (4:3 & 16:9)
- Fully and Easily Editable Content
- Pre-made Color Themes
Frequently Asked Questions
- What are Harvey Balls used for in presentations?
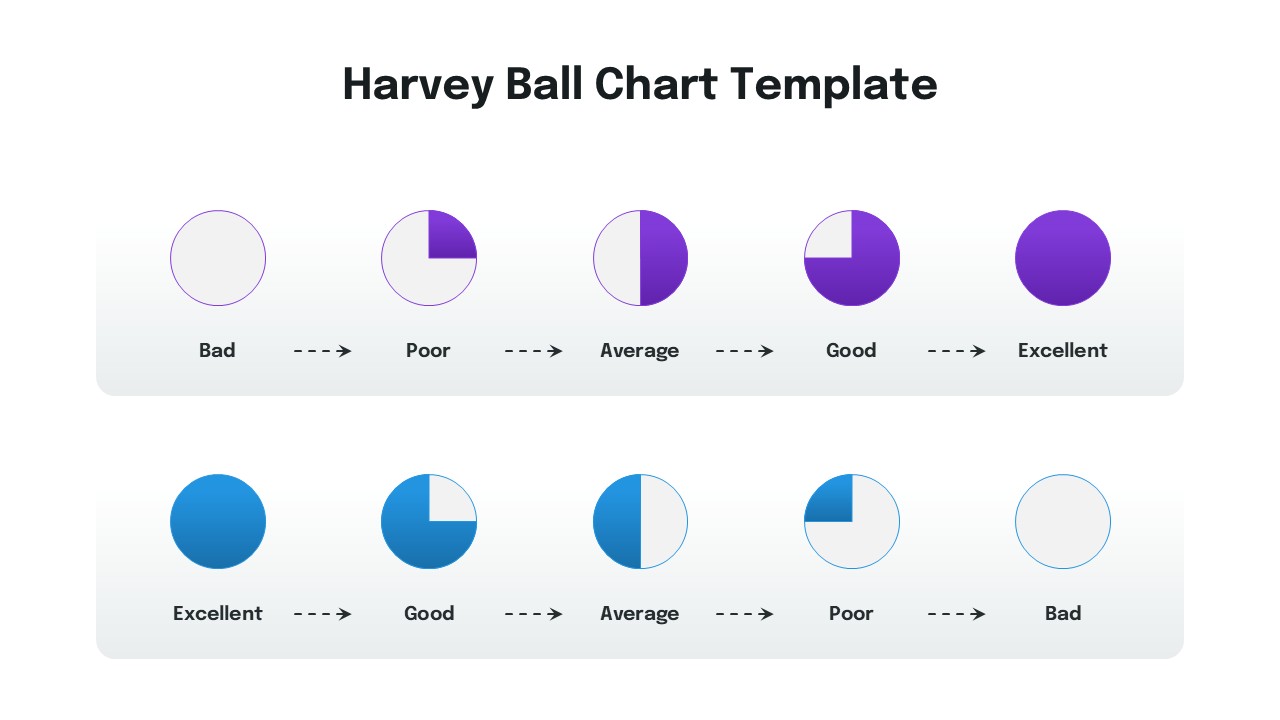
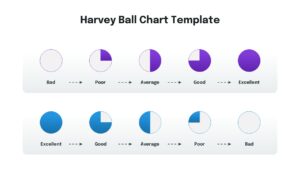
- They are round symbols used to communicate qualitative information, such as the extent to which an item meets a particular criterion, project progress, or feature completion.
- Can I change the colors of the Harvey Balls?
- Yes, all symbols are vector-based and fully editable. You can change the fill and outline colors to match your company\'s branding in just a few clicks.
- Are these Harvey Ball slides compatible with Google Slides?
- Absolutely. This template is designed for multi-platform support, working perfectly in both Microsoft PowerPoint and Google Slides without formatting issues.
- How do I edit the fill percentage of a Harvey Ball?
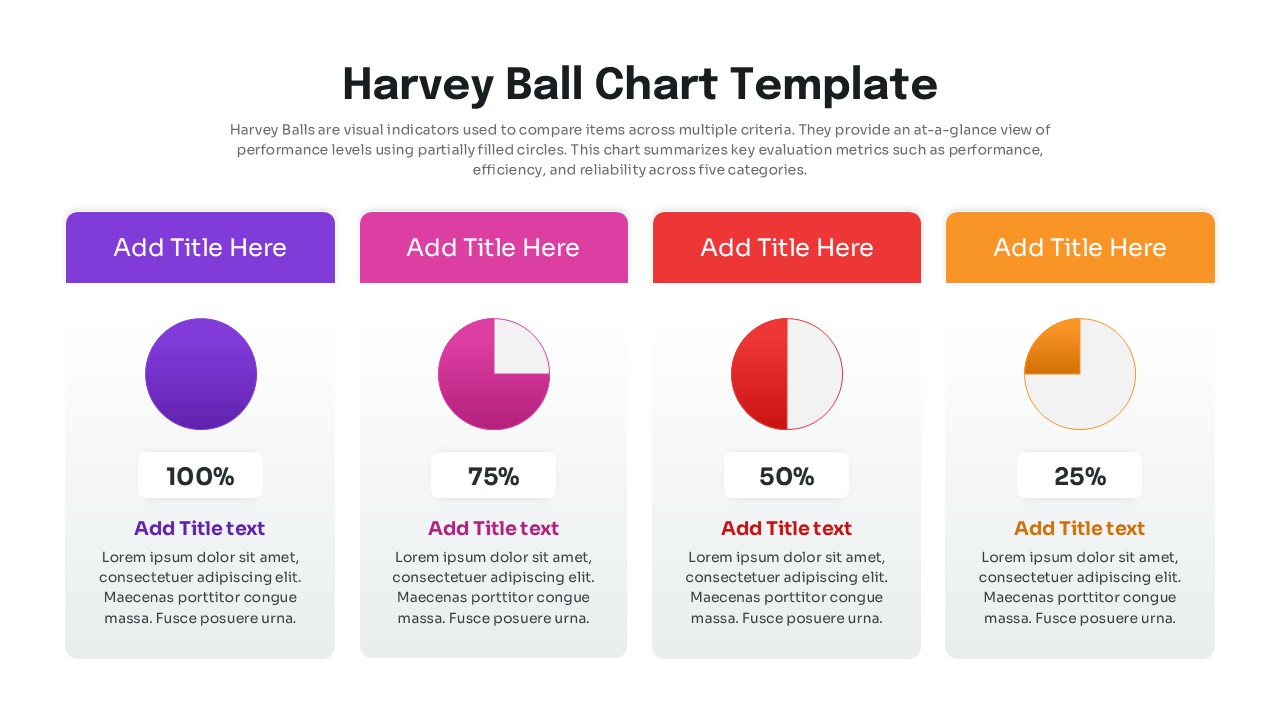
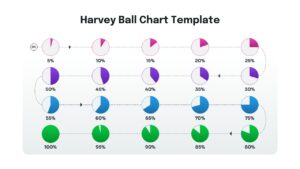
- The balls are created as shapes or icons. You can easily swap between different fill levels (25%, 50%, 75%, 100%) provided in the template to reflect your specific data.
Related Templates
-
 Free
Free -
 Free
Free -
 Free
Free -
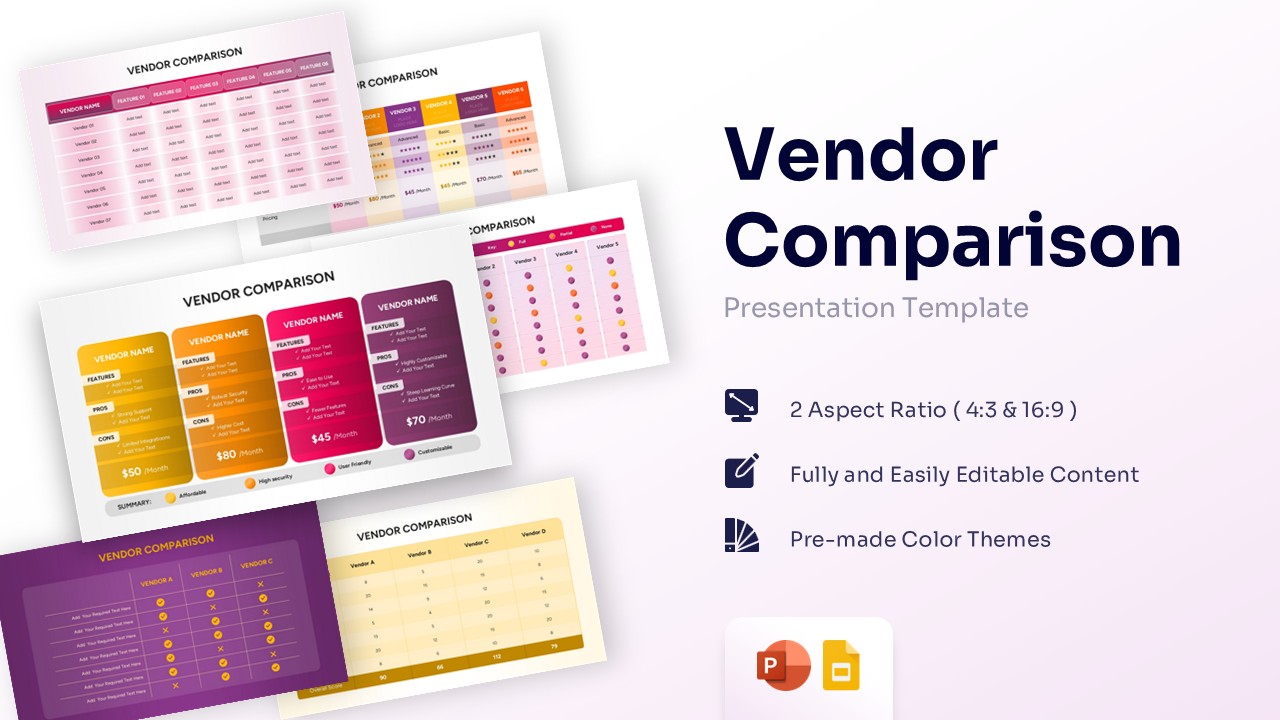
Free Vendor Comparison Template for PowerPoint & Google Slides
Charts & Graphs
Free