Free Line Chart Template for PowerPoint & Google Slides
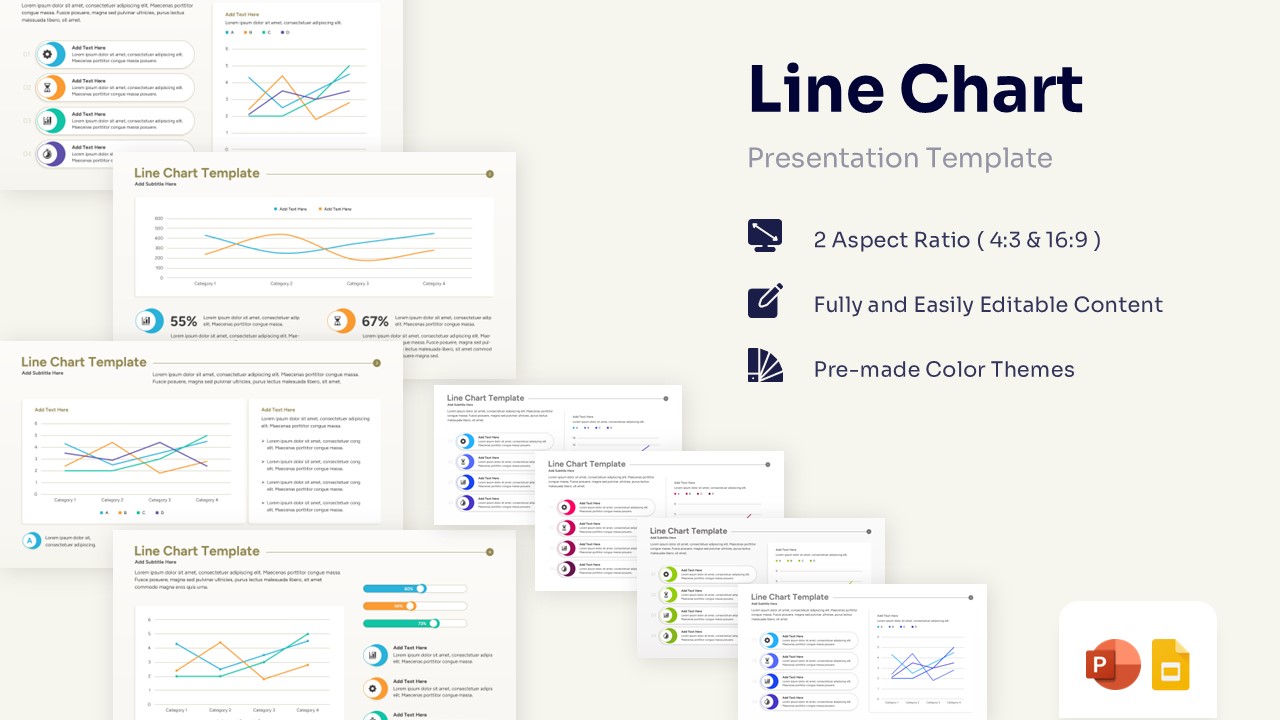

Line Graph Template for Data Visualization
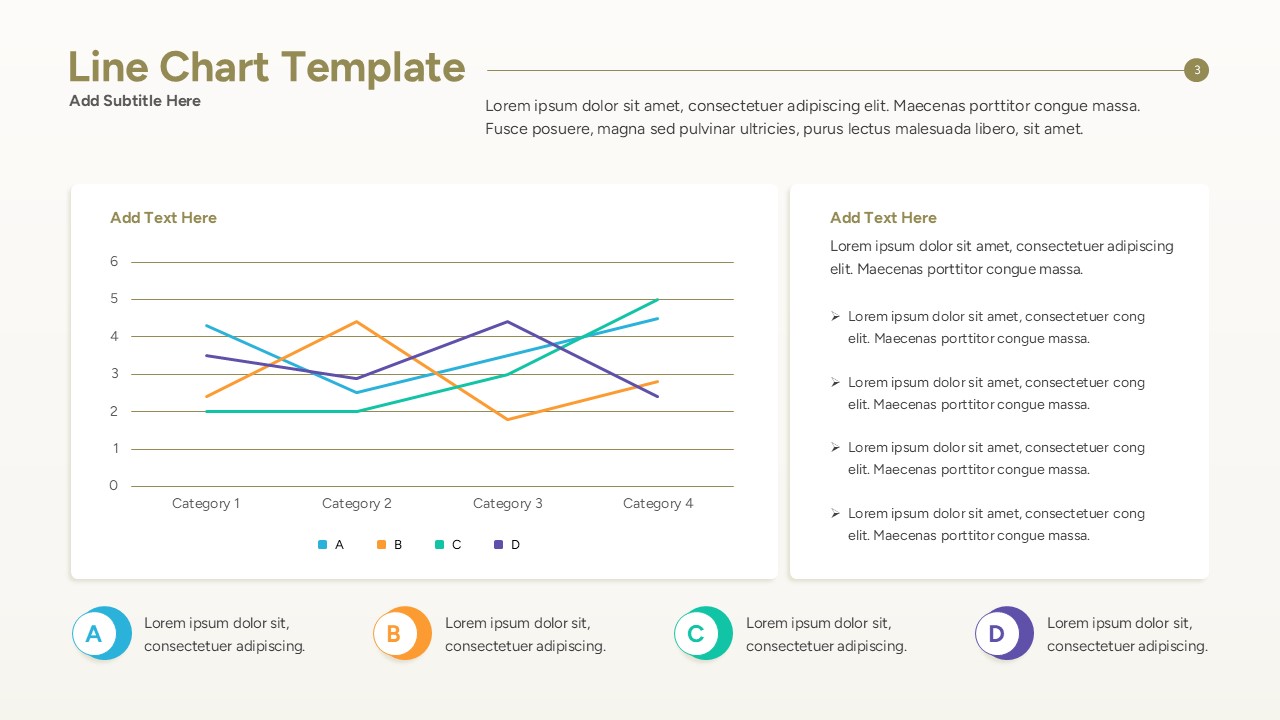
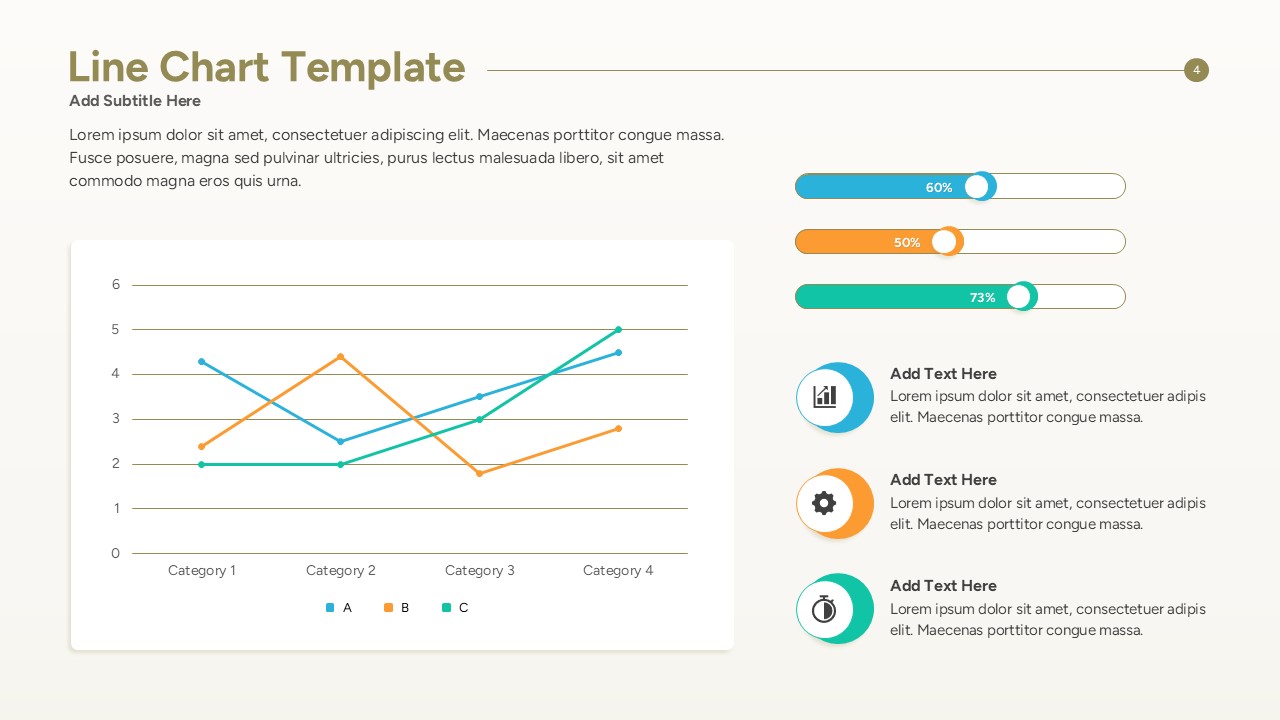
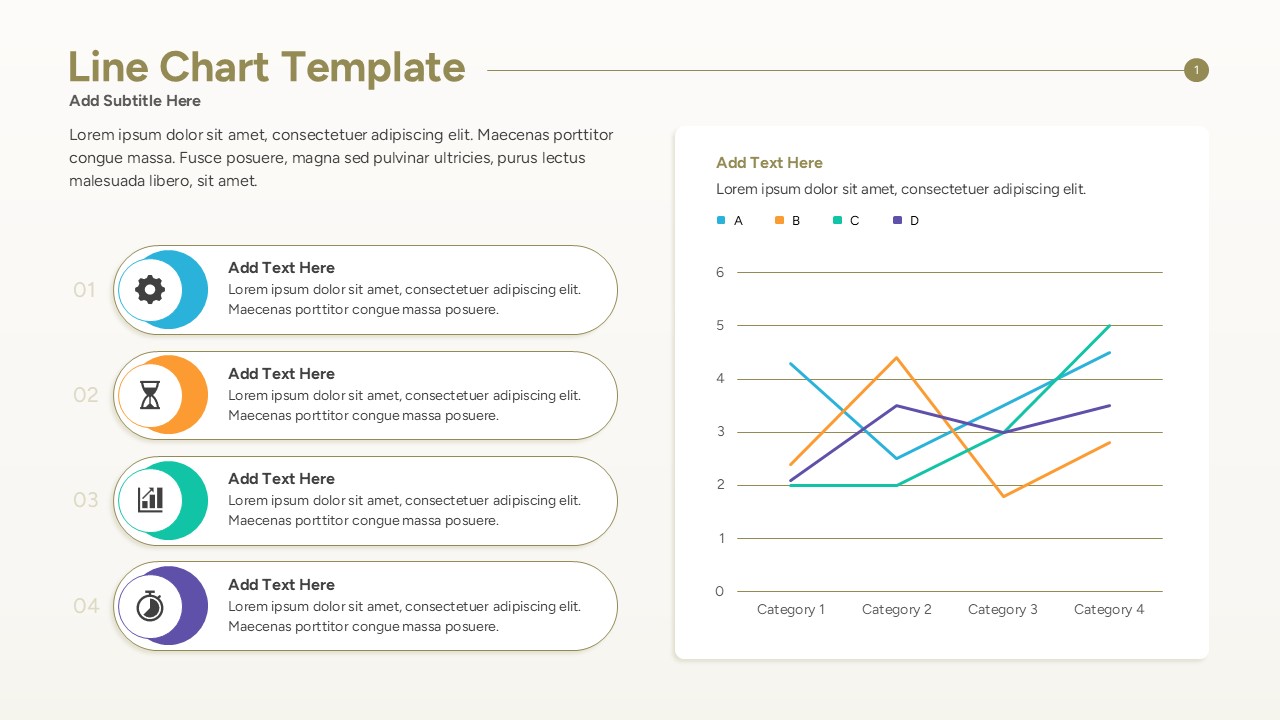
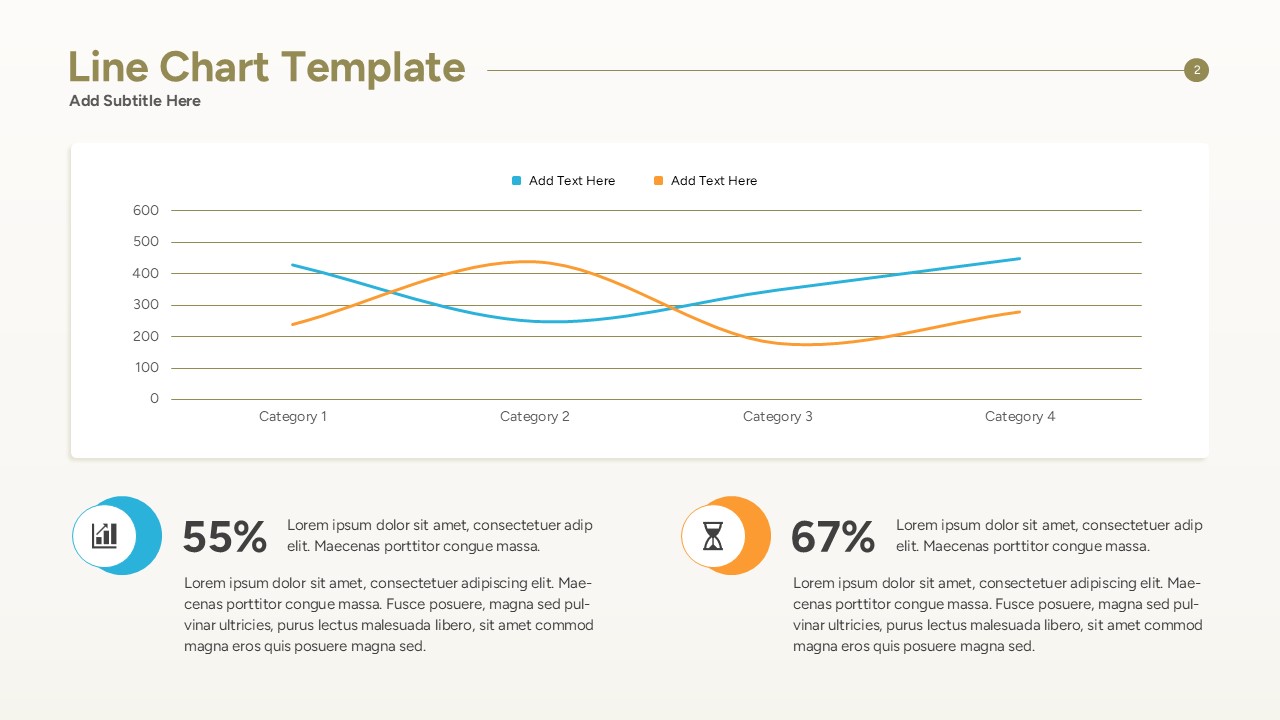
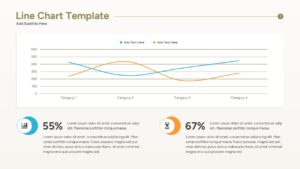
Level up your data reporting with this free line chart template, tailored to highlight statistical trends and performance trajectories. PresentoVerse designers have given this Line Area Chart Template a clean, professional palette of teal, orange, purple, and green against a pristine white background. It is ideal for strategic quarterly reviews, financial planning sessions, and executive board meetings where data drives the conversation. This line chart template deck brilliantly incorporate intersecting line graphs, integrated percentage indicators, horizontal progress bars, and neat pill-shaped text boxes to depict ideas with absolute clarity.
Designed for individuals in the business world such as financial analysts, marketing managers, and corporate strategists. These statistical charts serve to showcase crucial performance indicators, market research results, and revenue projections over specific timeframes. Utilizing these appealing infographics simplifies complex quantitative information while keeping listeners engaged and well-informed throughout the presentation.
This template equips you with the essentials to articulate thoughts effectively and convey your message effortlessly to stakeholders. Download it now. Enhance your presentations with these crafted slides! Also explore our collection of free infographic templates for more creative and professional presentation designs.
Key Features
- 100% Vector-Based Graphics
- Fully Layered & Organized
- Multi-Platform Support
- Theme Color & Theme Font
Frequently Asked Questions
- Can I edit the data directly in PowerPoint?
- Yes, you can easily right-click the charts to \"Edit Data\" which opens an integrated spreadsheet for quick updates.
- Are the colors customizable to my brand?
- Absolutely. The template uses theme colors, so changing the global color palette will update all charts instantly.
- Does it work on Mac and Windows?
- Yes, this template is fully compatible with PowerPoint on both operating systems and works perfectly in Google Slides.
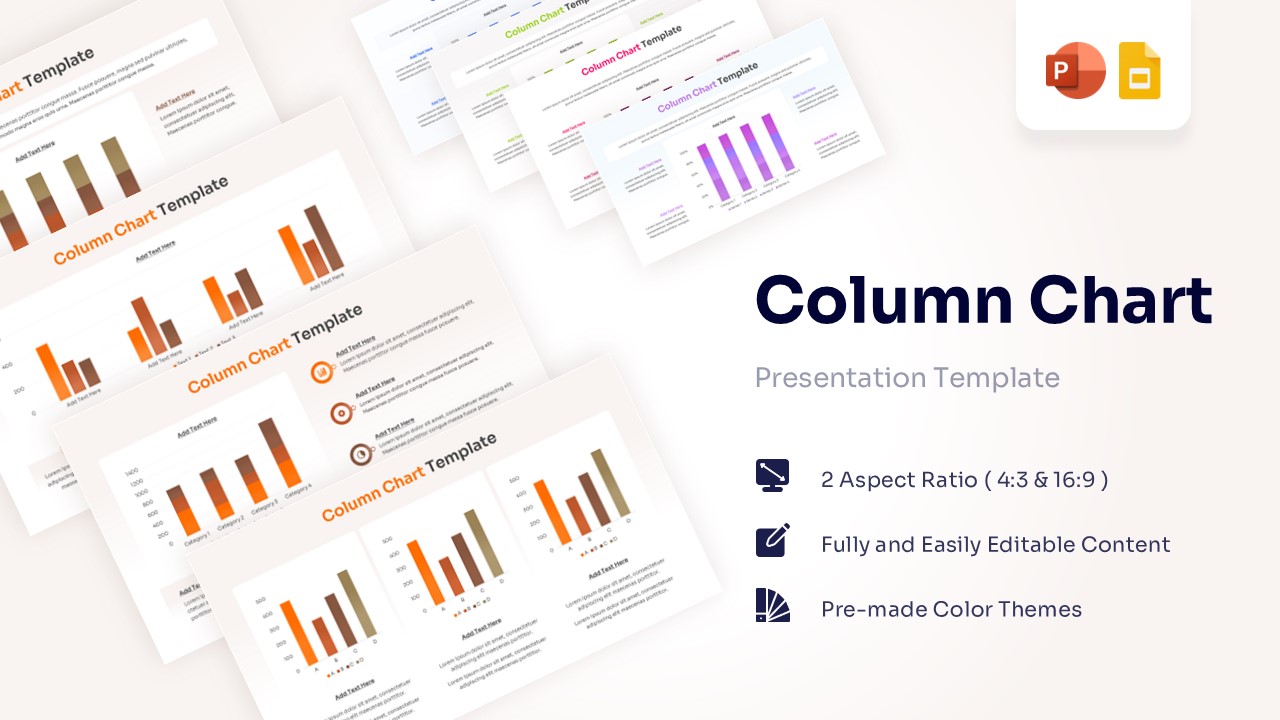
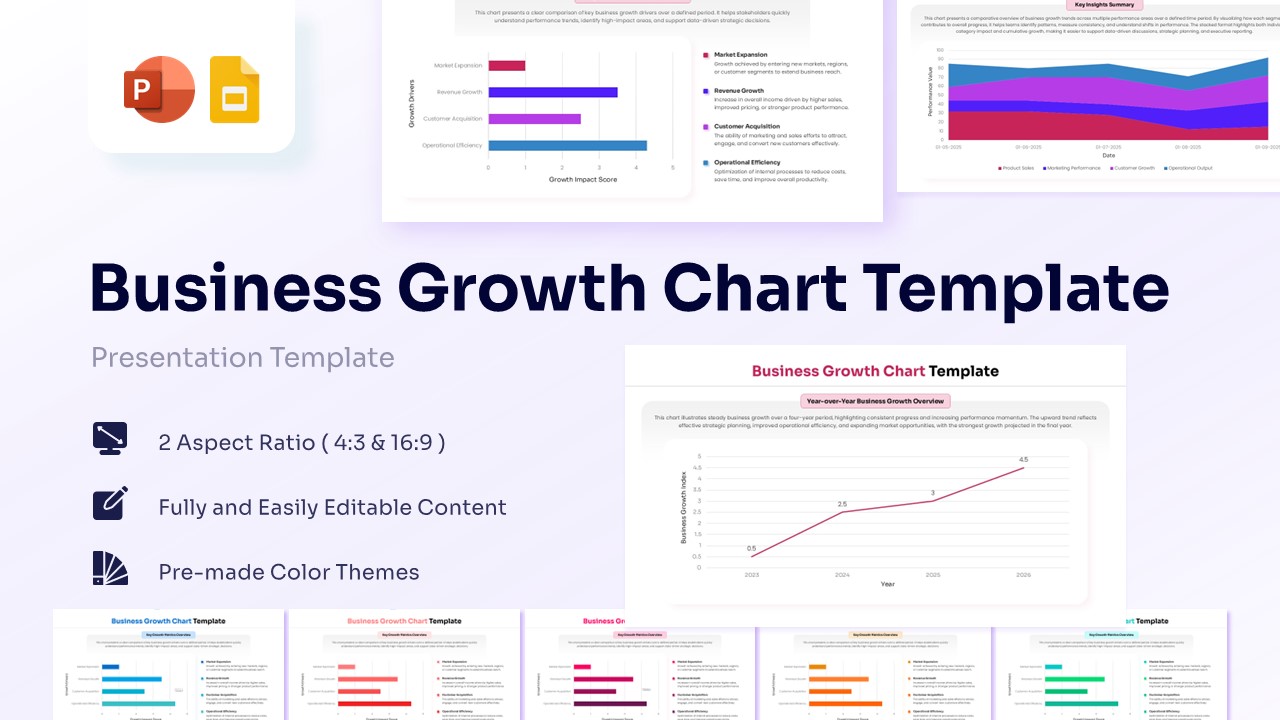
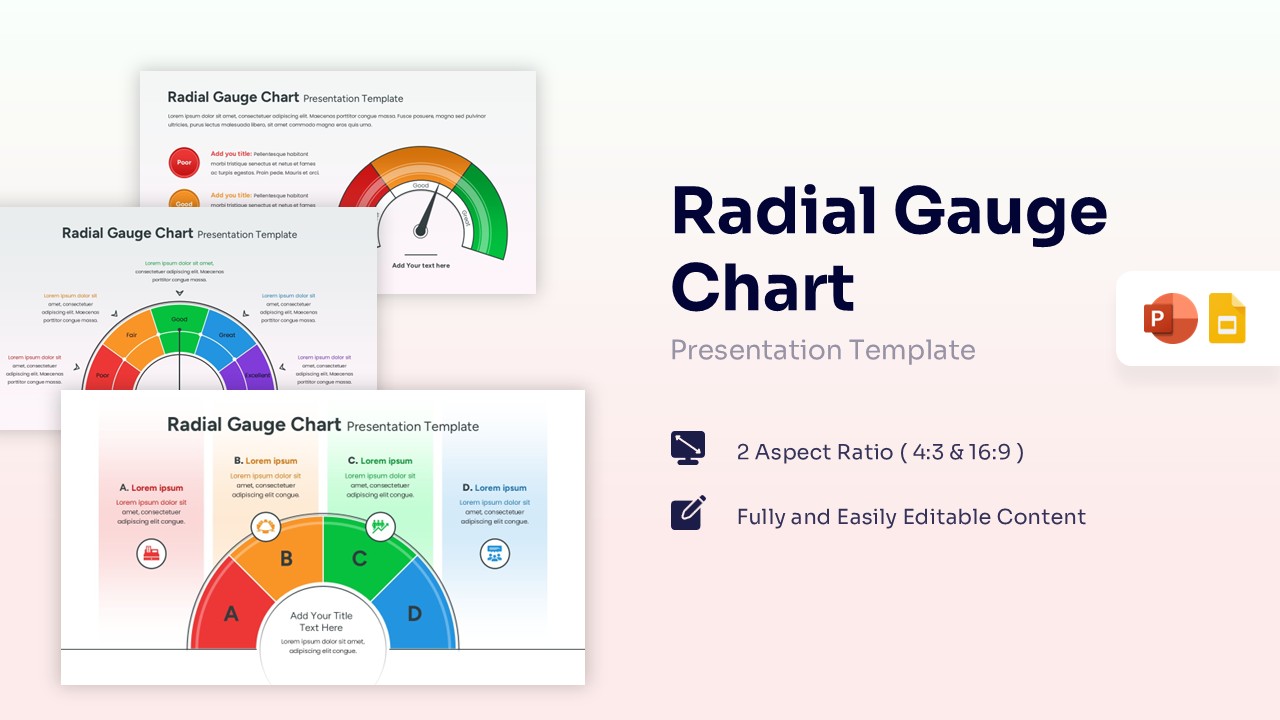
Related Templates
-
 Free
Free -
 Free
Free -
 Free
Free -
 Free
Free