
Spider Diagram Template for PowerPoint & Google Slides
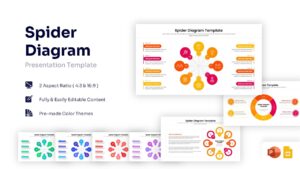
Dynamic Hub and Spoke Model for Idea Mapping
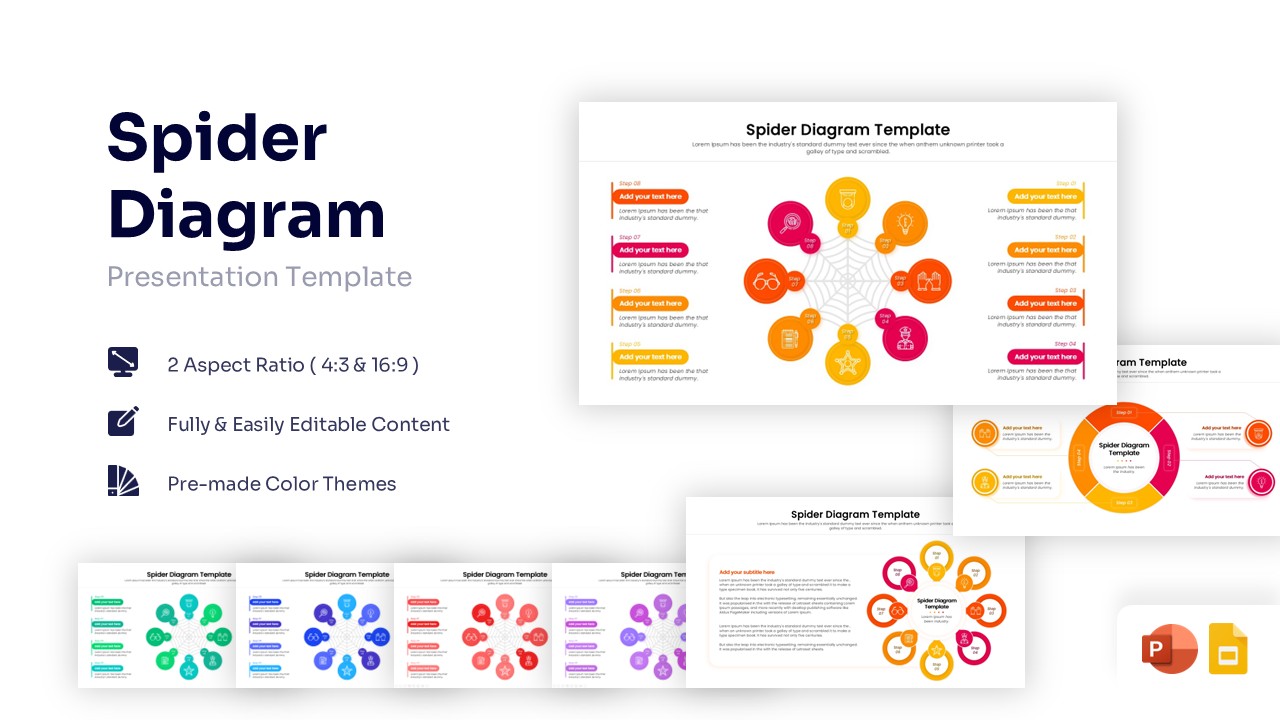
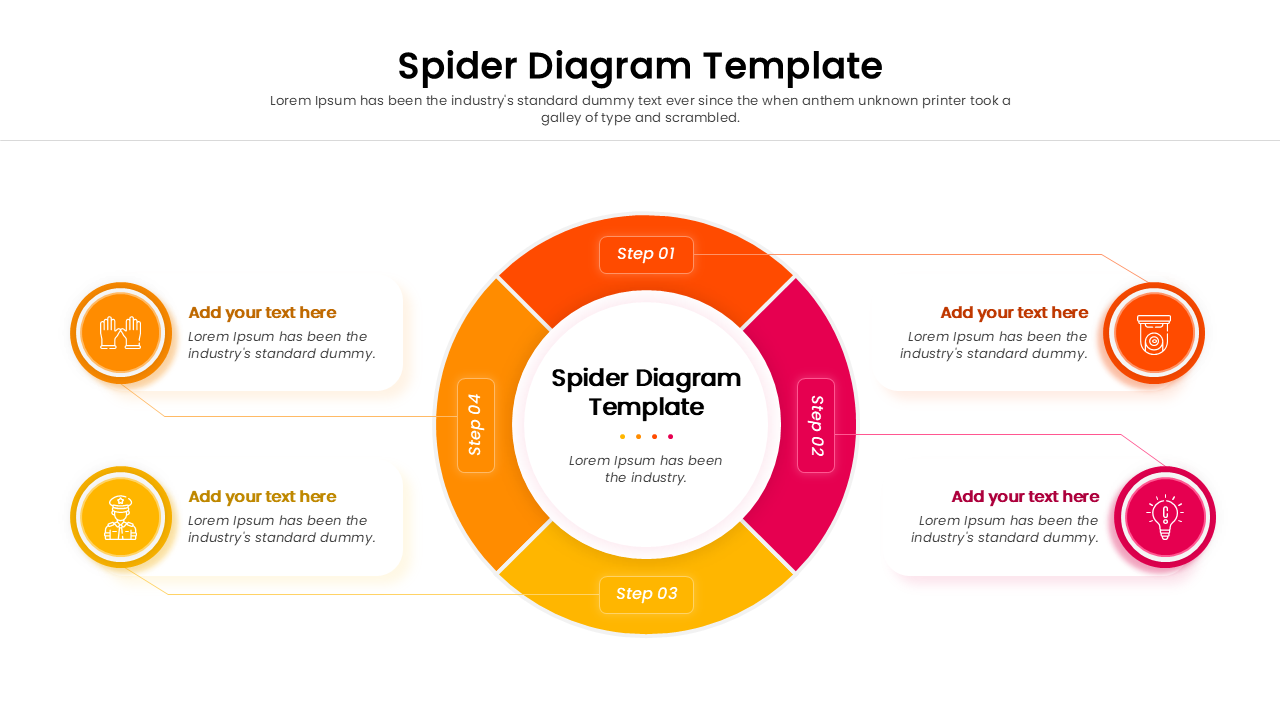
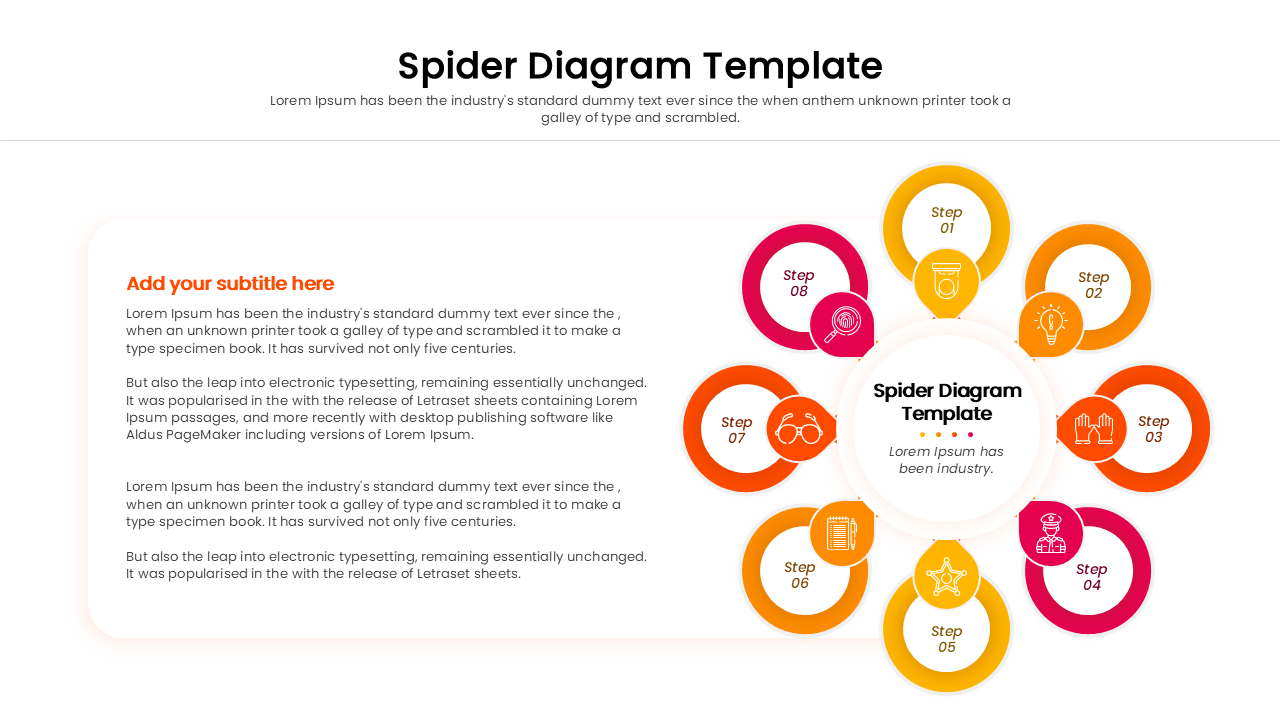
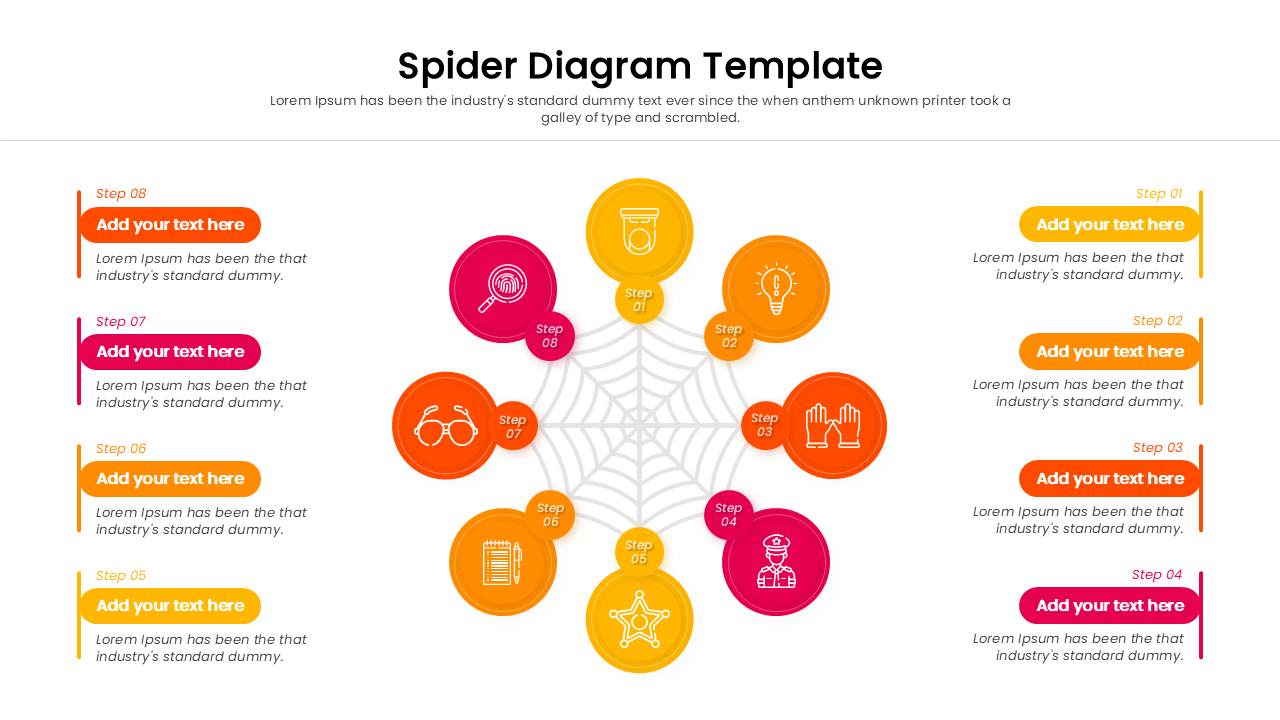
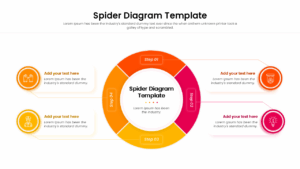
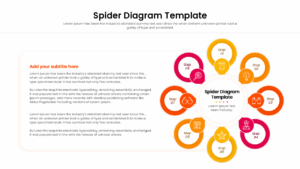
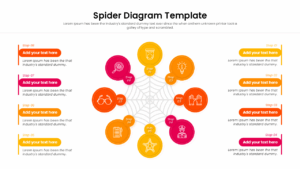
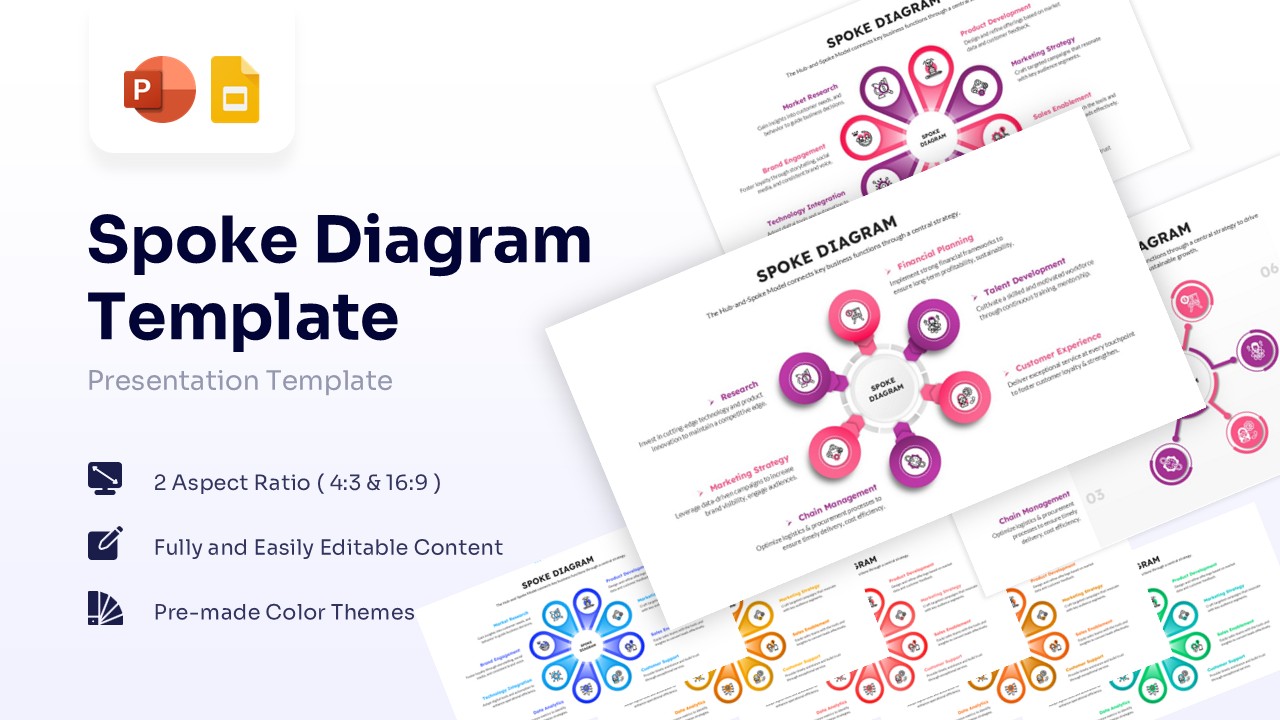
Structures brainstorming sessions beautifully using a central web graphic radiating into eight vibrant, icon-ready circular nodes. This free Spider Diagram Template simplifies the breakdown of multi-faceted concepts, allowing presenters to anchor a core theme in the middle while branching out related sub-topics or procedural steps along the web’s axes. This circle diagram presentation template elevates data visualization through distinct color separation, crisp line work mimicking a spider’s web, and highly visible vector icons that ensure clear cognitive orientation for the audience. Delivered as an entirely editable asset, it is an invaluable tool for corporate environments, specifically excelling in project planning, feature mapping, and outlining comprehensive marketing strategies. Beyond the boardroom, educators and researchers can leverage this framework to map out interconnected historical events or scientific classification systems with ease. Its clean, professional format fits seamlessly into modern business decks and educational resources alike.
Key Features
- 100% Vector-Based Graphics
- Fully Layered & Organized
- Multi-Platform Support
- Theme Color & Theme Font
Frequently Asked Questions
- Can I change the icons in the spider diagram?
- Yes, every icon is fully editable. You can easily swap them out for different symbols that better represent your specific steps or industry.
- How do I adjust the colors to match my brand?
- The template uses theme colors, so you can change the entire color palette through the \"Design\" tab in PowerPoint or the \"Theme\" settings in Google Slides.
- Is it possible to use only 5 or 6 steps instead of 8?
- Absolutely. Since the graphics are vector-based and layered, you can simply delete the unnecessary nodes and text boxes to fit your specific process.
Related Templates
-
-
 Free
Free -
-
 Free
Free